We’re excited to introduce a new “Calendar” tab to the Class Attendance dashboard! This tab displays the class schedule in a clean, calendar-style layout, allowing you to quickly scan what's happening across clubs by day and time.
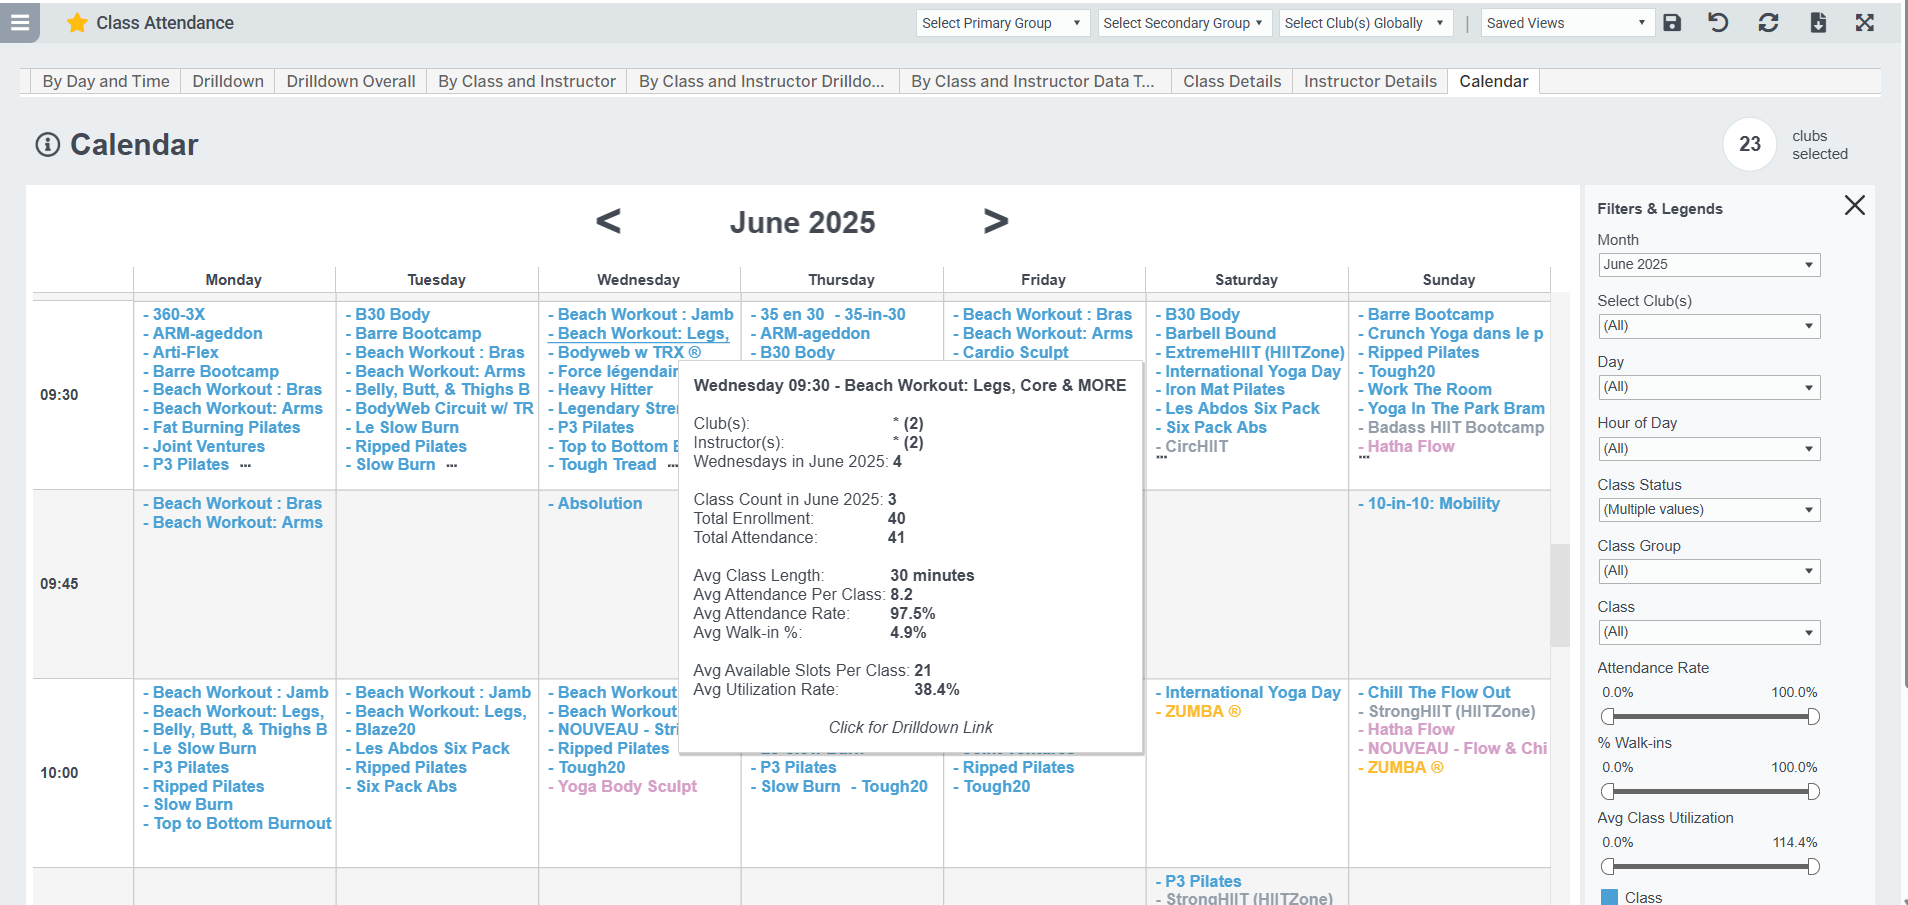
The view includes interactive hover tooltips showing key metrics like attendance, enrollment, class count, utilization rate, and more—making it easy to assess performance at a glance. You can filter by month, club, day, hour, class group, and other key dimensions. Class names are color-coded by Event Group, and each class includes a drilldown link to more detailed data about the class. This view is ideal for spotting scheduling gaps, tracking new class adoption, and managing class mix across locations.
Metric Definitions
- Total Attendance = [Registered & Attended] + [Walk-in Count]
- Registered & Attended =
For GroupX Instructor Count clients: [Instructor Count] - [Walk-In Count]
For GroupX Taking Attendance clients, and all other clients: [count of specific enrolled members marked as attended) - Instructor Count = number entered by instructor as total attendance
- Walk-In Count = number of walk-in attendees entered by instructor
- Attendance Rate = [Registered & Attended] / [Enrolled Members]
Note: a negative attendance rate indicates the Walk-In Count was greater than the Instructor Count; this is likely a typo. - Utilization Rate = [Total Attendance] / [Total Slots Available]
Related Articles & Dashboards
- Class Attendance By Day and Time
- Class Attendance Metrics By Class and Instructor
- Class Attendance Monthly Trends and YOY Compare
- Creating Class Groups