Industry-first proprietary AI learns the normal and expected range for hundreds of trends within each club location, taking into account seasonality, and identifies any metrics spiking or trending above or below what would be ordinarily expected.
Why use SmartSights?
- Identify Key Trends: Analyze attendance, revenue, and membership trends.
- Highlight Growth Areas: Find where your clubs are performing well.
- Spot Declining Metrics: Identify areas needing improvement.
- Find Peak and Off-Peak Times: Understand usage patterns.
Here's how to use the SmartSights Weekly dashboard:
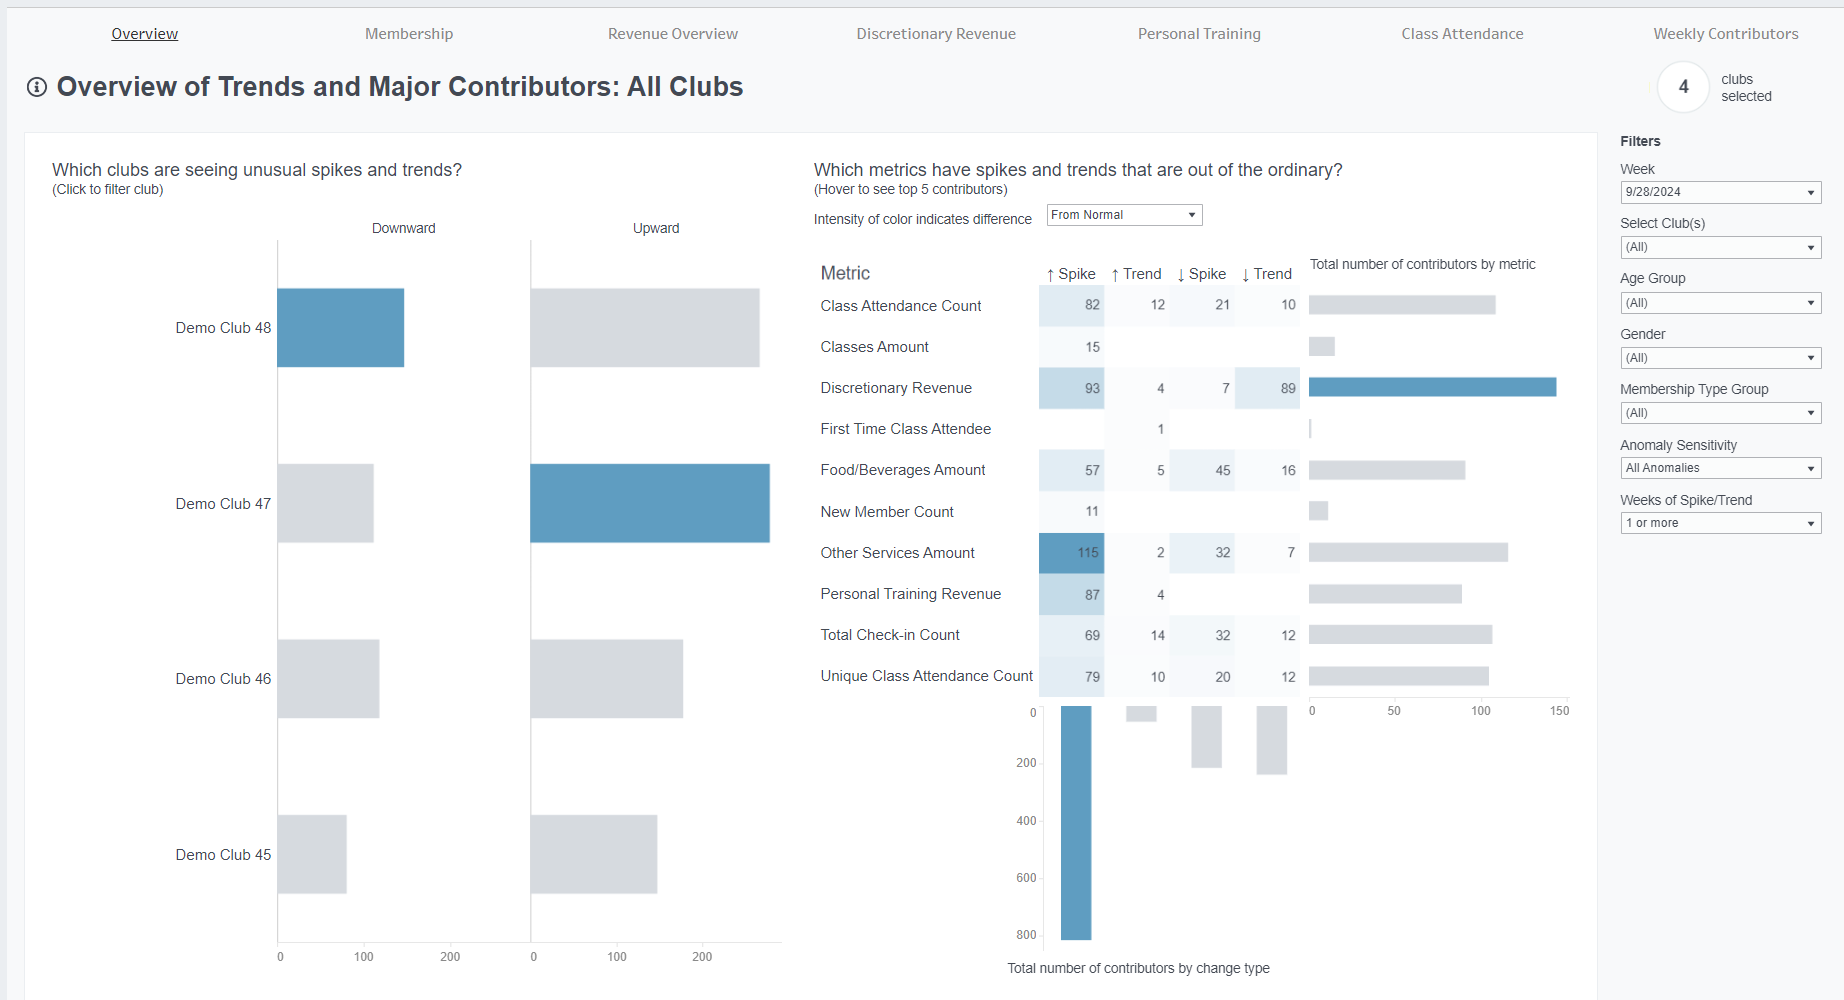
Overview Tab
See which clubs have the most trends and spikes. Click a club in the left side panel and the right side filters to show you just those club's items. Hover over the graph on the right side to see the actual member segments driving the trends. When you find an area you want to drill into more, navigate to the appropriate detail tab
Detail Tabs
For each of the key metrics Easalytics tracks in Membership, Revenue, Discretionary Revenue and Personal Training, you can use the SmartSights detail tabs to see the top Member Segments showing positive or negative trends or spikes.
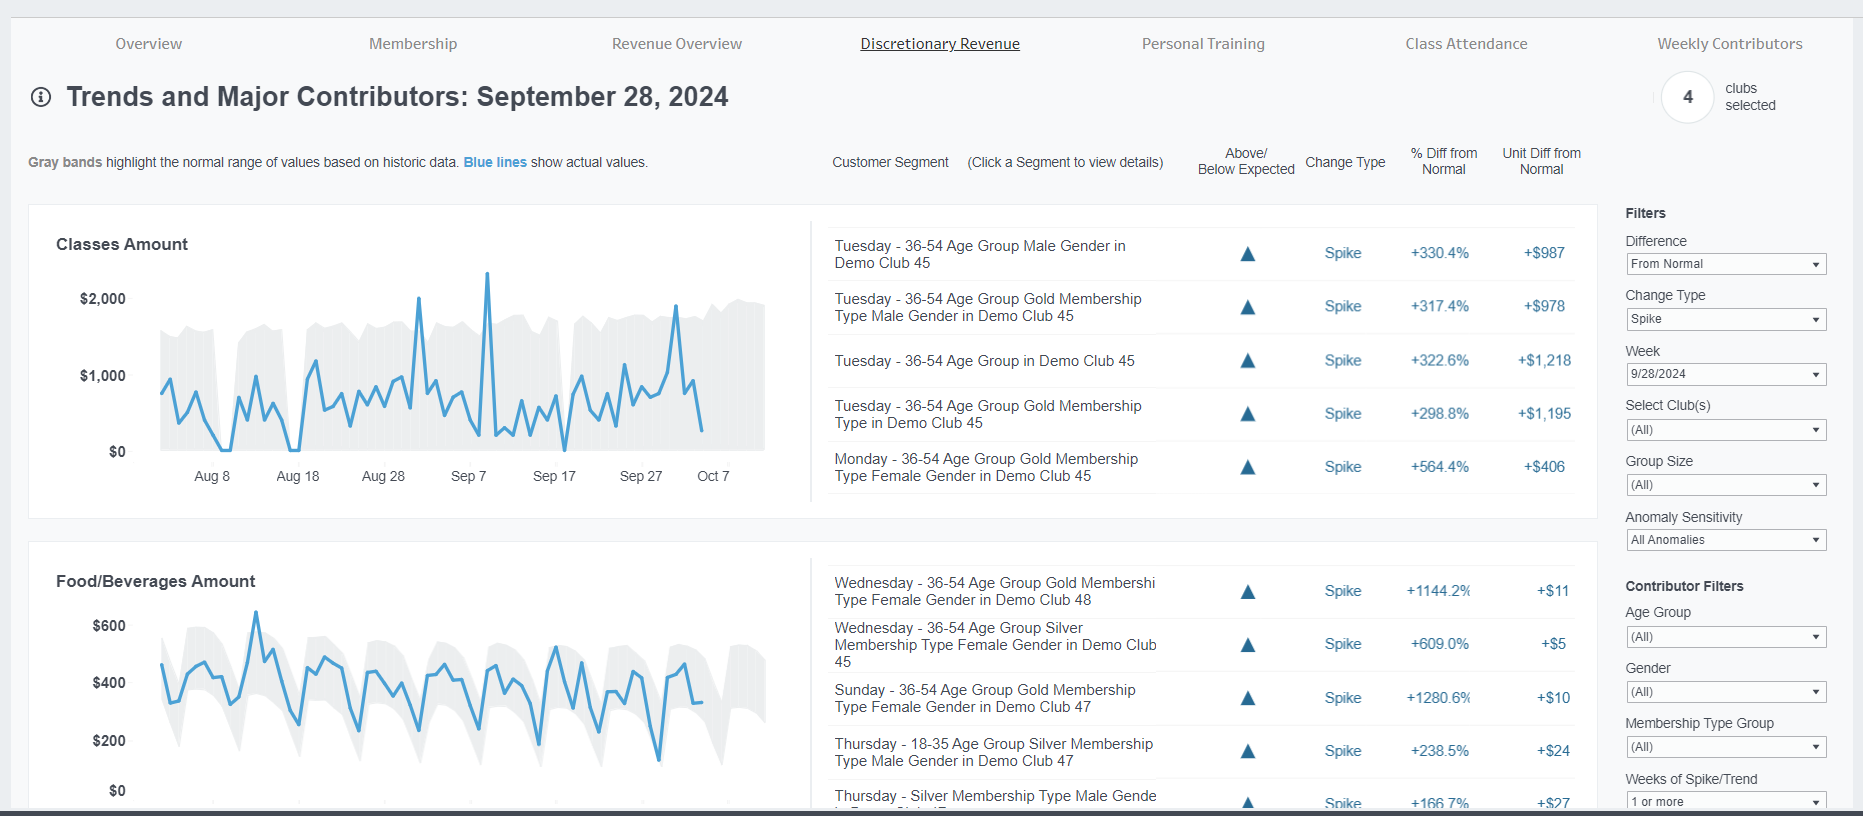
Use the filters on the right to do things such as:
- See only the largest member segment impacts by using the Group Size filter to segments over 1000 members in size
- Determine the number and scale of anomalies you are shown by using the Anomaly Sensitivity filter to select various settings between All Anomalies and Largest Anomalies Only
- Reduce irrelevant noise by filtering out membership type groups you may want to exclude, such as Staff or comped memberships
SmartSights Key Concepts & Terms
- Change Type
- +/- Spike indicates there is an anomaly in the trend that is above/below normal range.
- +/- Trend indicates there is a consistent ongoing increase/decrease of a KPI value nearing or exceeding the upper/lower confidence band for at least 3 weeks.
- Mathematically, the KPI value needs be outside the +/- 75th percentile of the normal range to qualify as trend.
- % Difference from Normal: The percent difference of a KPI from the median of the normal range
- Unit Difference from Normal: The unit difference of a KPI from the median of the normal range
- Group Size: The quantity of members included in the segment
- Normal Range: Values can be Above, Normal, or Below.
- Normal signifies a KPI value that falls within the AI-calculated Normal Range using historic data.
- Above signifies a KPI value that is greater than the upper limit of the AI-calculated Normal Range using historic data.
- Below signifies a KPI value that is less than the lower limit of the AI-calculated Normal Range using historic data.