Welcome to Easalytics!
This guide will help you get up and running quickly—whether you are an Administrator setting up the platform for your organization or a general user navigating dashboards for insights.
This guide is divided into two major sections:
Section 1 — Administrator Setup Guide
-
Configuration, data grouping, validation, and dashboard deployment. This section is for ensuring your data is clean, grouped correctly, and ready for reporting.
Section 2 — General User Guide
-
How to on Navigation, filtering, drilldowns, exporting, and personal customization of Easalytics web portal. This section is for everyday users across your teams.
Quick Start Checklist
For Administrators
☐ Review your Profit Centers and assign them to Profit Center Groups
☐ Review your Membership Types, assign them to Groups and flag member count exclusions
☐ Group Events into Event Groups and assign Event Group Types
☐ Set up Club Groupings and Square Footage
☐ Choose your preferred member count metric (New Members, NMUs, or New Agreements)
☐ Validate your data vs. your MMS
☐ Enter your Goals data (optional package)
☐ Enter your Leads Marketing Spend data (optional package)
☐ Build your Topline Dashboards and choose default widgets
☐ Share or Assign dashboards to your team
☐ Request Live Training for your Users
For General Users
☐ Use the side nav, search bot, or Report Finder to locate dashboards
☐ Apply filters (club, profit center groups, membership type groups, quick dates)
☐ Hover tooltips and click drilldowns for detail
☐ Use the Global Club Filter for cross-dashboard navigation
☐ Favorite dashboards you use most
☐ Save custom views for your recurring analyses and reporting
SECTION 1: Administrator Setup Guide
Easalytics will import almost all your data from your member management system. This guide will take you through setting up Easalytics for your everyday use.
1. Initial Setup: Data Grouping, Metrics & Data Validation
First, complete these steps to ensure your reporting is clean and accurate:
-
Group your Profit Centers
-
Group your Membership Types
-
Group your Events
-
Set your Club Groupings and square footage
-
Select your member count metric
Video → Managing Groupings
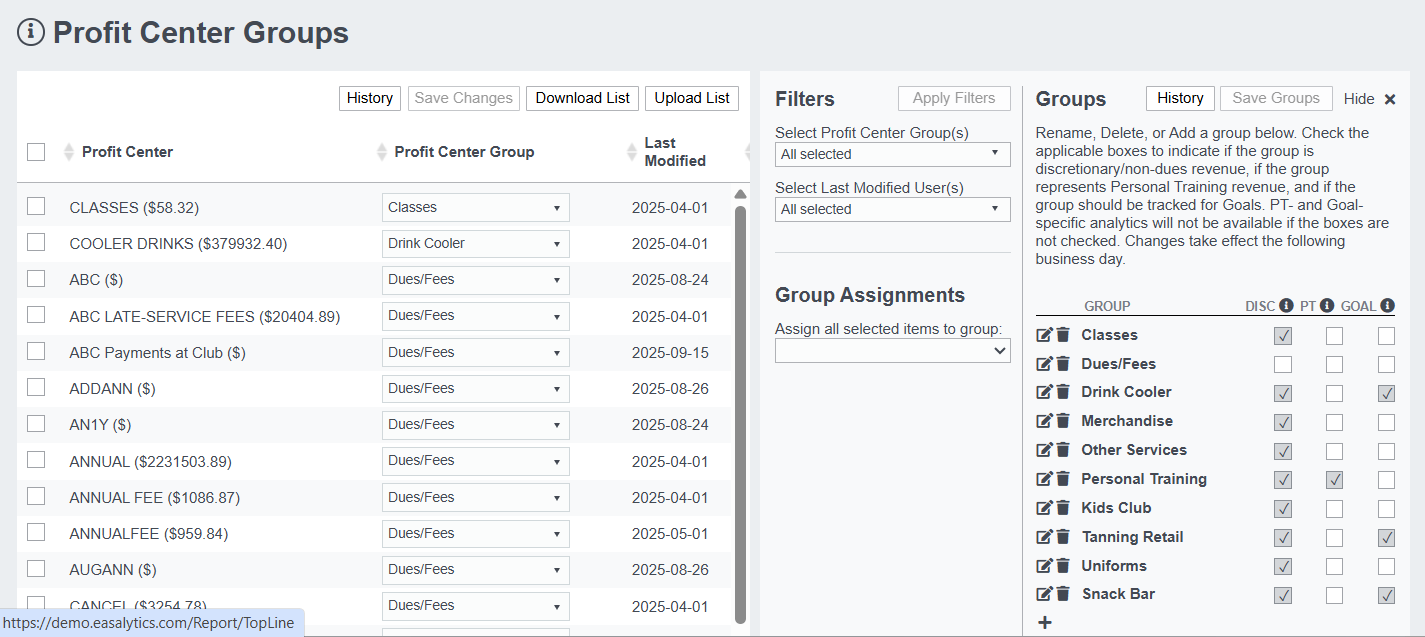
1.1 Revenue & Profit Center Grouping
Easalytics ingests every transaction from your MMS with the related Profit Center, General Leger, or Accounting group, which we call "Profit Centers".
These granular Profit Centers can be grouped into higher level categories to make reporting and analysis easier. We start with standard default Profit Center Groups and organize your initial profit centers into those groups.
Start your review with the Revenue Compare dashboard to see your revenue amounts and the initial grouping of Profit Centers into Profit Center Groups. If you want to regroup profit centers, you can go to the Profit Center Group Admin page.
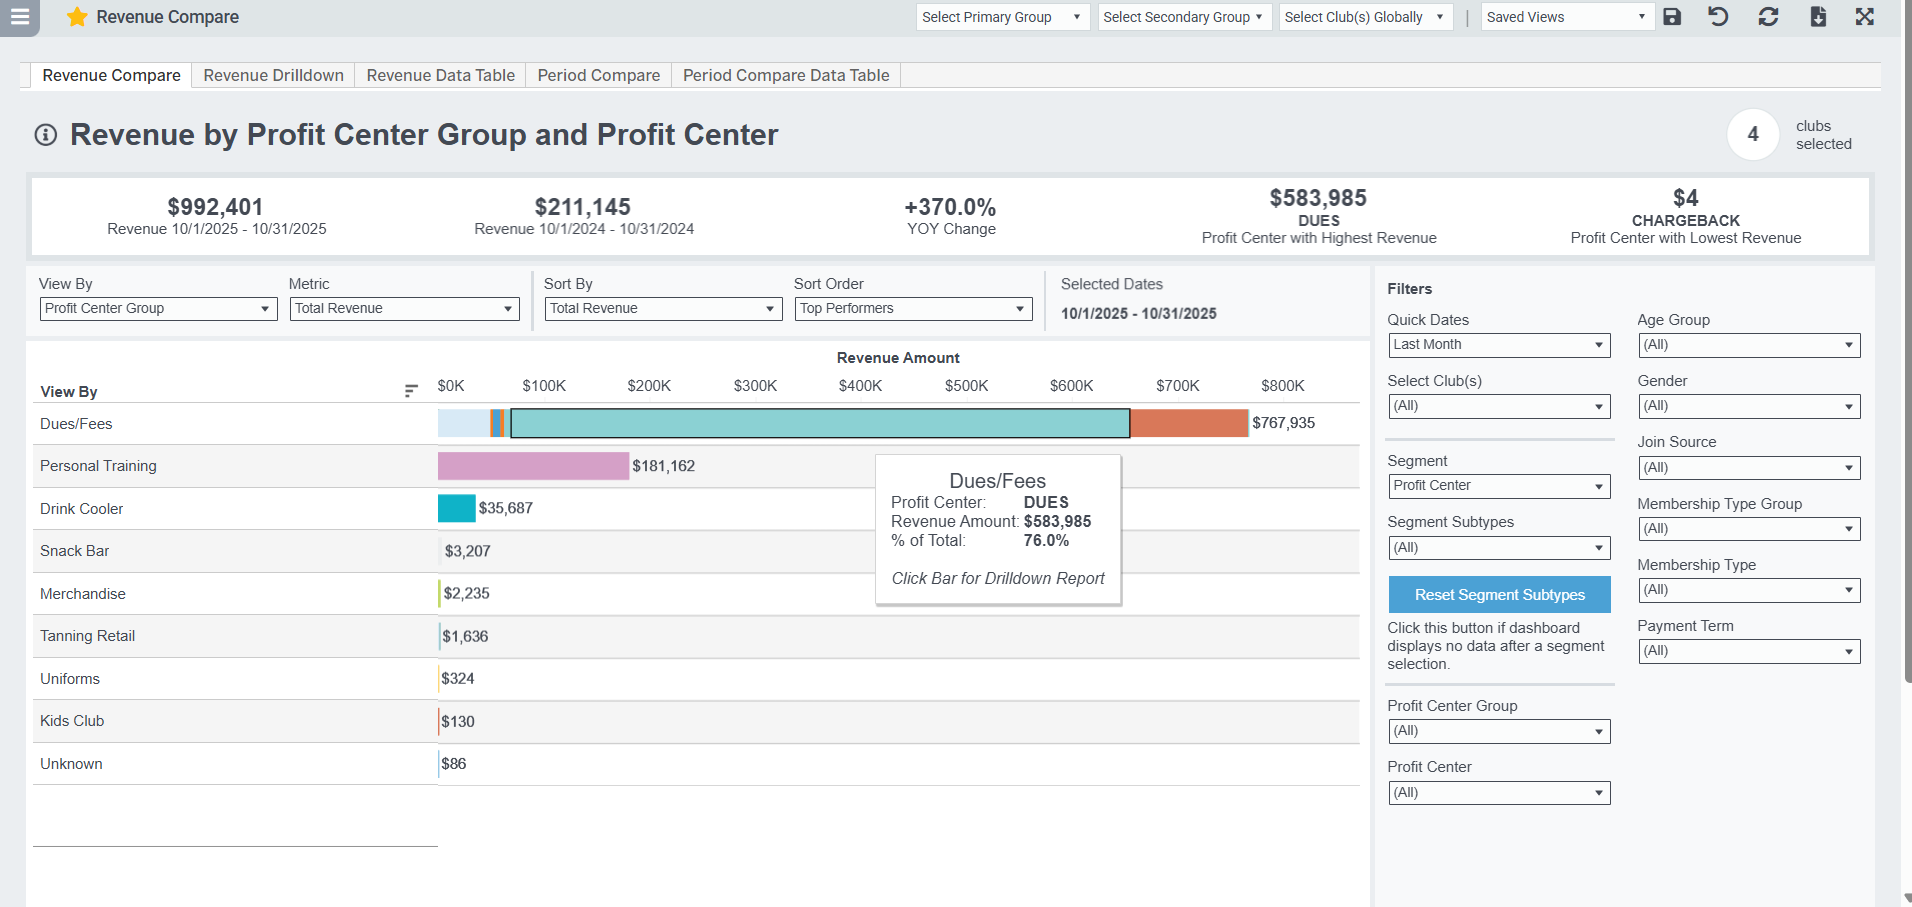
Easalytics has special categorization for Profit Center Groups if they are Personal Training specific and if they are Discretionary or Non-Discretionary. These additional flags in the Admin page will drive specific revenue reporting for PT and Discretionary revenue.
Once you have your Profit Center Groups set up, and flagged as PT, Discretionary or not, you can jump into our revenue-specific dashboards: <link>
1.2 Membership Type Grouping
In Easalytics we ingest all your member and agreement data. Your member management system (MMS) has membership types or user groups, which we call Membership Types.
These granular Membership Types can be grouped into higher level categories to make reporting and analysis easier. We start with standard default Membership Type Groups and organize your initial membership types into those groups.
Start your review with the Member Mix dashboard to see your total and new members and the initial grouping of Membership Types into Membership Type Groups. If you want to regroup membership types, you can go to the Profit Center Group Admin page.
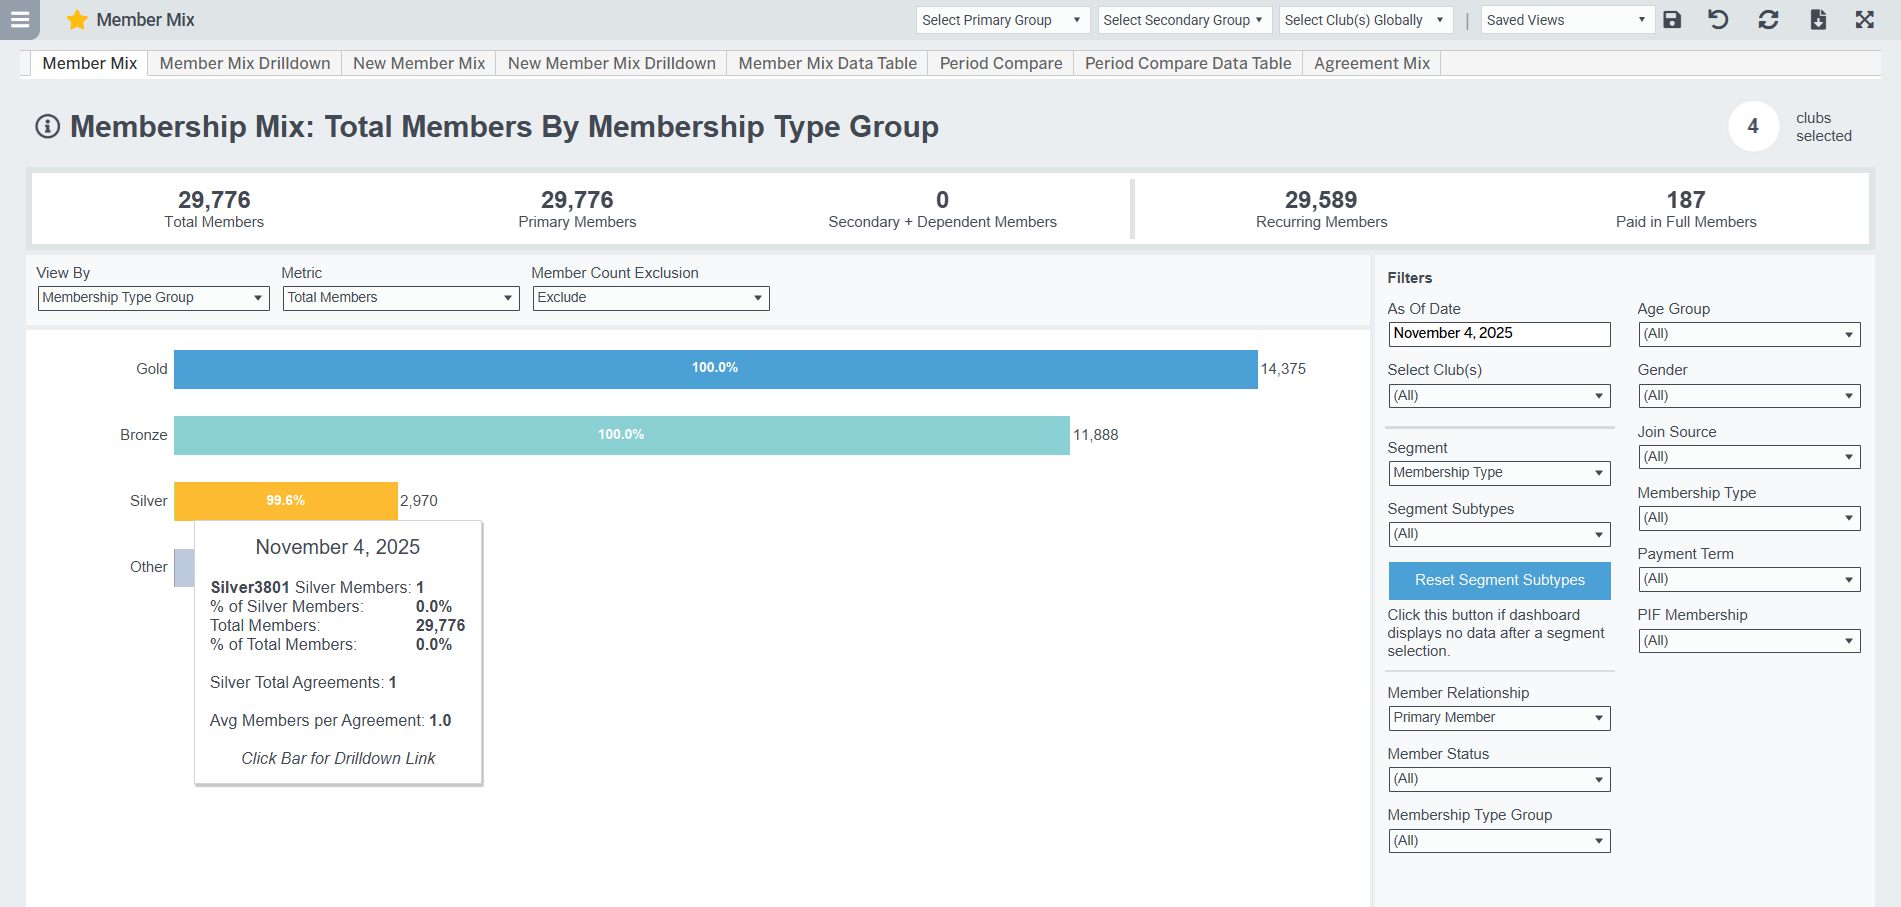
Easalytics has special categorization for Membership Type Groups if they should be excluded from member counts in reports. A perfect example of this is if you have a Staff membership type, you can group it as Staff and mark that as Exclude so you don't report on those people. You can always update each dashboard and show those members.
Once you have your Membership Type Groups set up, and flagged as Exclude or not, you can jump into our member-related dashboards. <link>
1.3 Event & Activity Grouping
In Easalytics we ingest all your calendar events, including personal training, court reservations, group fitness class registration and attendance, etc. from your member management system (MMS).
We combine all your events into one list in our Event Grouping Admin page. Here you can group events into any categories you'd like for reporting. We give you some default groupings like Classes and Personal Training, and you can add or change whatever you like.
Event Groups need to be further grouped into Class, PT, PT Intro, or Other in order to flow to select reports. Ultimately you'll end up with a hierarchy of Event Group Type (Class, PT, Other), Event Group (e.g. Yoga, Ride, 60-Min PT, 30-Min PT, Blocked Time), and the specific events (e.g. Yoga Flow-Tuesdays).
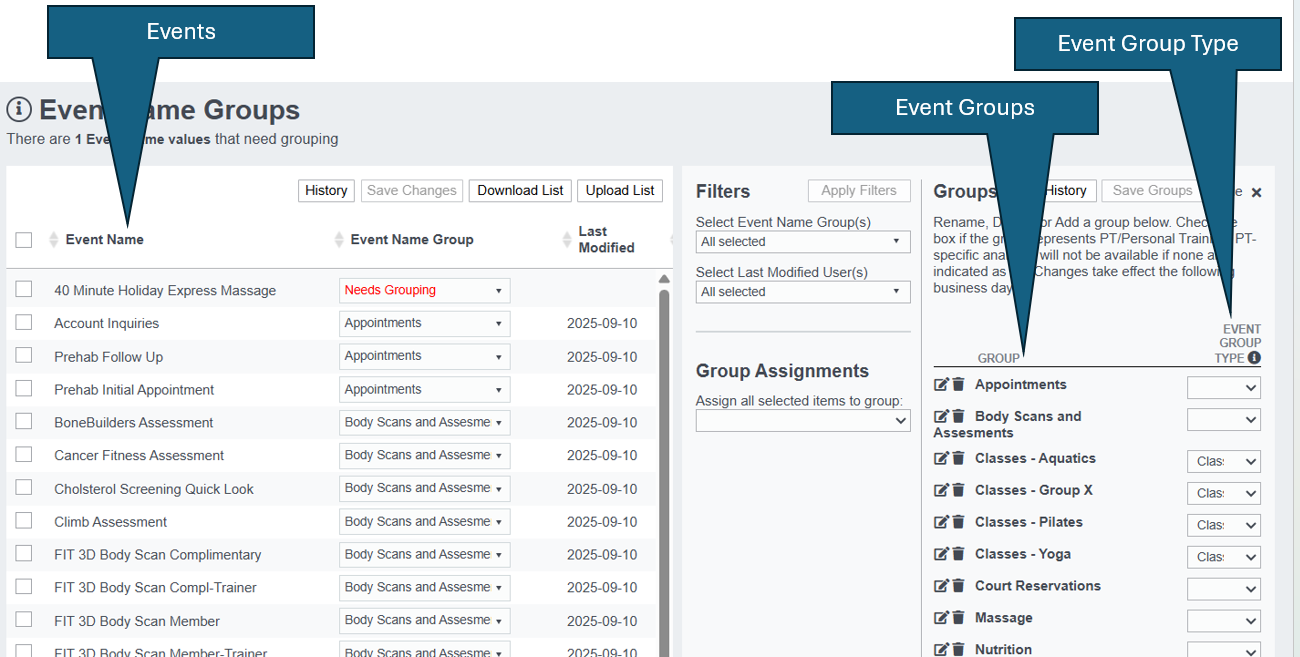
Depending on your Event Group Type categorization, you'll find reports targeted to those areas.
Event Groups marked as Class will show up in these dashboards:
- Class Attendance
- Class Attendance Trends
- Class-specific attributes on Member List
Event Groups marked as PT will show up in these dashboards:
- PT Usage
- PT Usage Trends
- Trainer Performance
- PT-specific attributes on Member List
Event Groups marked as PT Intro will show up in these dashboards:
- Salesperson Performance
- Trainer Performance
- PT Scorecard (Goals)
- PT Intro-specific attributes on Member List
Event Groups not marked will show up in this dashboard:
- Event Attendance
1.4 Club Grouping
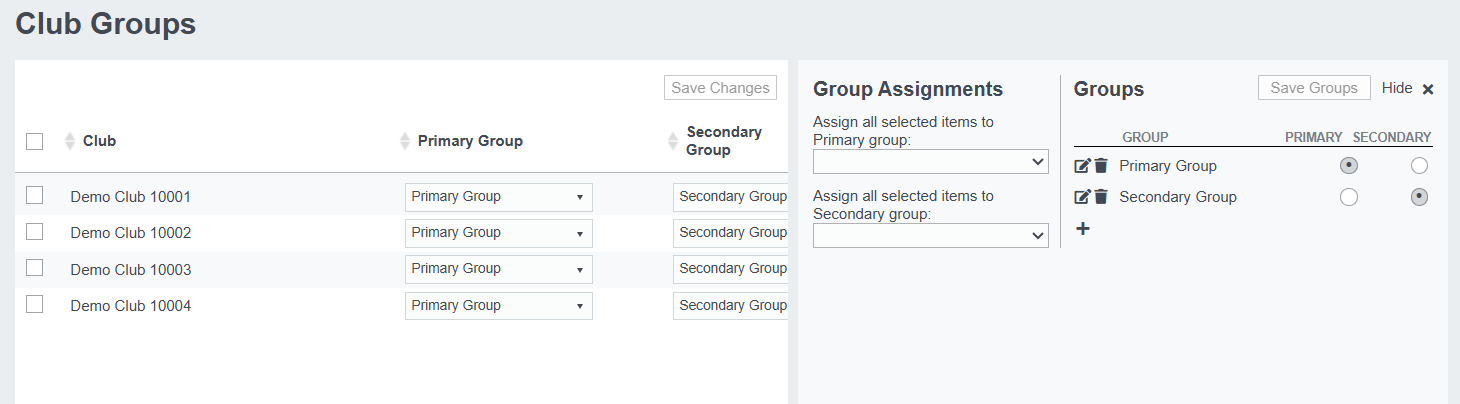
Easalytics allows you to group your clubs into higher-level categories such as Regions, Markets, or Brands. These groups are used for filtering and roll-up reporting across all dashboards.
You can add new Club Groups or reassign clubs as needed. Once updated, these groupings will flow into dashboards like Revenue, Membership, Check-ins, and Goals during the nightly data refresh.
Video → Primary & Secondary Groupings Filters
1.5 Square Footage Setup
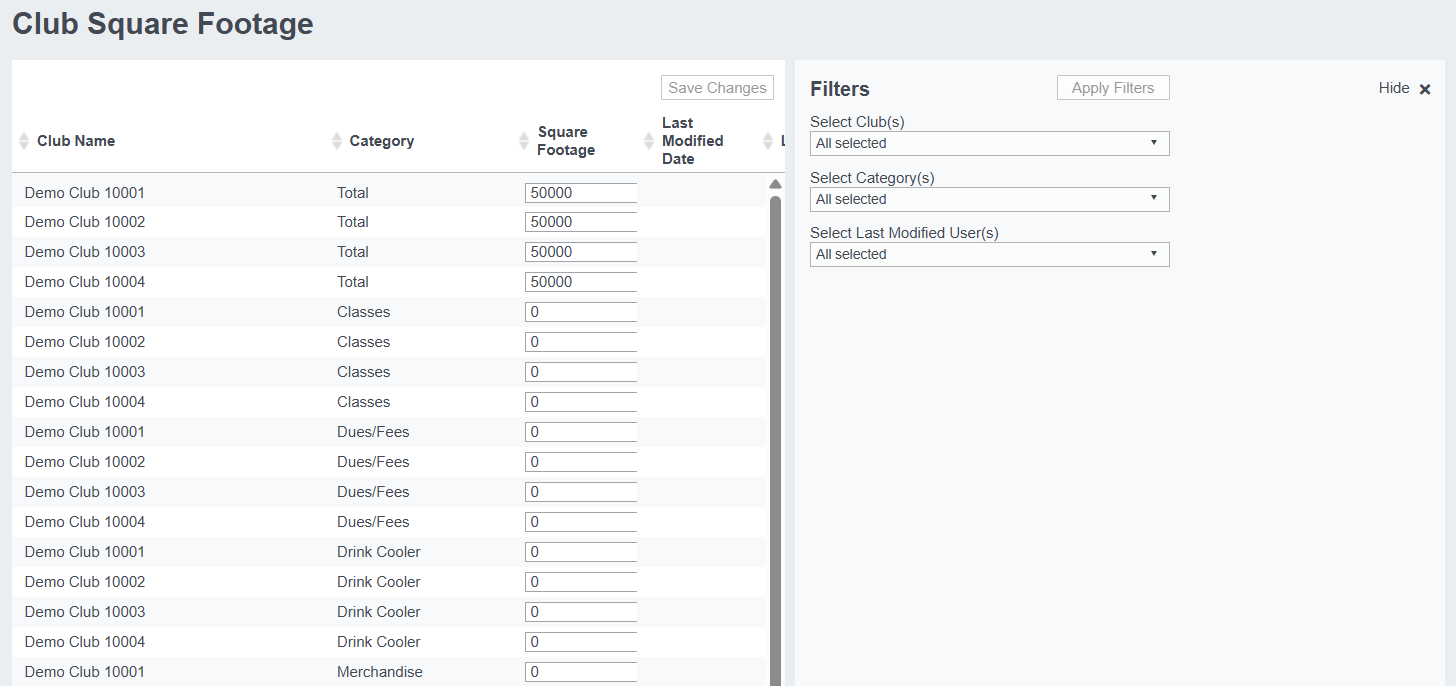
On this screen you can enter the square footage for each club. This value powers the Revenue per Square Foot dashboard and allows accurate comparisons across clubs of different sizes.
Enter or update the square footage for each location and for each Profit Center (e.g. Snack Bar or Childcare Center), save your changes, and the updated values will appear in your Revenue Per Sq Ft dashboards after the next data refresh.
1.6 Ongoing Grouping Maintenance
As you add new Profit Centers, Membership Types, and Events in your MMS, the next day those items come into Easalytics ungrouped and need to be added to an existing group to show in reports accurately.
Admins will see an alert when you next login after a new item is ready to be grouped. Click on the bulleted item in the alert box, or go to the Admin section gear in the top right of the page, where you'll also see a red-dot alert.
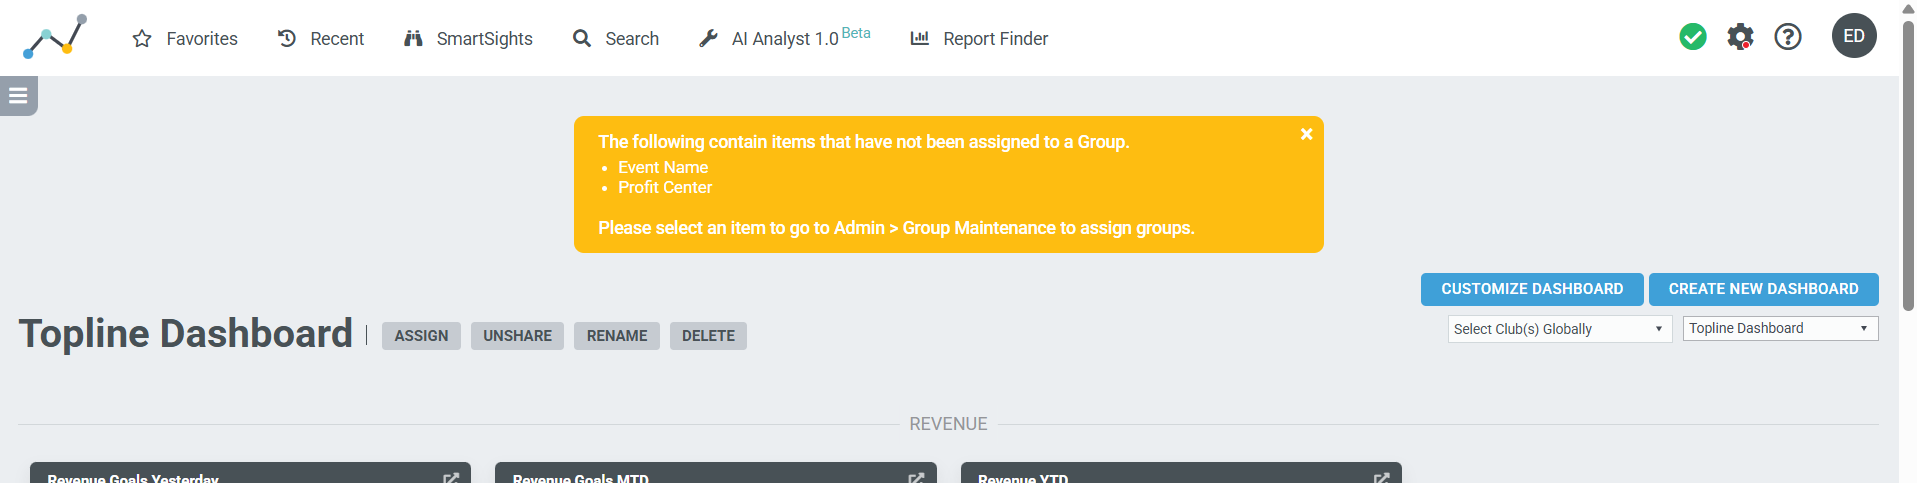
Once you're on a grouping page, you'll see the items that "Need Grouping". Assign those to an existing group, or create a new Group, save it, then assign the new item to the new group.
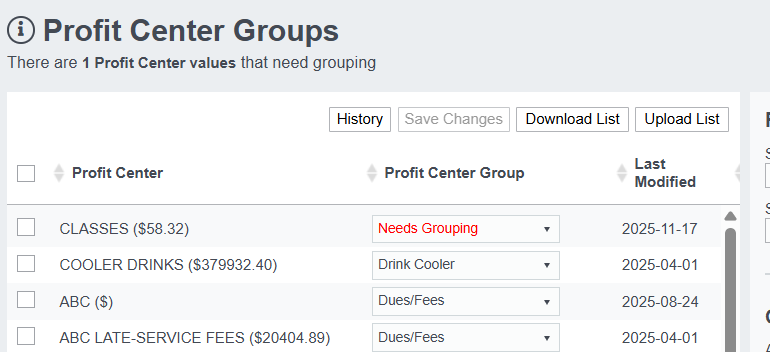
Grouping refresh overnight as new data is processed and refreshed into Easalytics dashboards.
2. Selecting Your Member Count Metric
New Members, New Member Units or New Agreements?
Next, you should think about these questions: Do you care about only new members who became brand new members in the time period, or are you more interested in knowing renews, rewrites and reinstated members as well? Or, are you more interested in how many agreements you added, regardless of how many individual members. Easalytics has an option for you.
- New Members: count of members who have joined your club and have a "since date" in the time period selected (e.g. MTD). Excluding any members rewriting, renewing, etc.
- New Agreements: count of primary member agreements that are new in the time period selected. This excludes secondary and dependent members, and rewriting or renewing agreements.
- New Member Units (NMUs): The number of members with an agreement sale date in the reporting period and an agreement type of New, Renew, Rewrite, Reinstated, or Add-on. Not including Continual Renew or Continual Rewrite agreement types.
Once you decide on your preferred metric, you can begin data validation and building out Topline dashboards with the appropriate widgets; and each member-related dashboard can be toggled to your preferred metric.
3. Data Validation
Now that you have your groupings set up, your categorization of membership type groups that should be excluded from your member counts, and the profit center groups flagged appropriately as PT, you can start data validation.
Member Counts (considering exclusions)
- When comparing member counts in Easalytics to your member management system, there may be some massaging to get things to match. Primarily you'll want to make sure your Membership Type Groups are set up and your member exclusions are marked (e.g. if you don't count staff in your MMS report, mark that in Easalytics as exclude).
- For ABC we use the Since Date and New Date for new members and new member units respectively.
- For Jonas we use agreement sale date as the start, and we use a combination of Jonas' Membership Type and primary Plan Description for the Membership Type. We also use the agreement club assign a member to a club, but we can use Jonas' home club field upon request.
Revenue Amounts
- For ABC MMS we use the DRDR report, and revenue is 2-days delayed.
- For Club Automation we use the transaction date and data is as of yesterday
- For Jonas we use the invoice date, data is as of yesterday, and Profit Centers are a combination of "GL" account name and "charge description".
Event Counts & Attendance
- Validate your class, event and PT calendar appointments match your MMS and your expected Attendance Count, Cancellations, Walk-Ins, etc. are matching what you normally report or expect
Check-in Counts
- Validate Easalytics check-in counts vs your MMS, your normal reporting, and expectations
4. Goals Data Entry
Optional -- for clients who purchase Easalytics' Goals product.
If your organization uses the Easalytics Goals product, you can upload monthly or annual goals for the metrics you want to track across your clubs. These goals power pacing, variance, and performance-against-goal dashboards throughout Easalytics.
You can enter goals for any of the following:
-
New Member Units (NMUs)
-
Revenue (total)
-
PT Revenue
-
PT EFT Revenue
-
New Dues Revenue
-
Revenue by Profit Center
-
You can assign goals to any individual Profit Center (e.g., Food & Beverage, Retail, Childcare, Supplements, etc.)
-
-
PT PIF Revenue
-
Net PT EFT Amount
-
New PIF Member Count
This gives clients full flexibility—goals can be high-level (e.g., Total Revenue) or very granular (e.g., Retail revenue goal, F&B revenue goal, PT EFT draft goal).
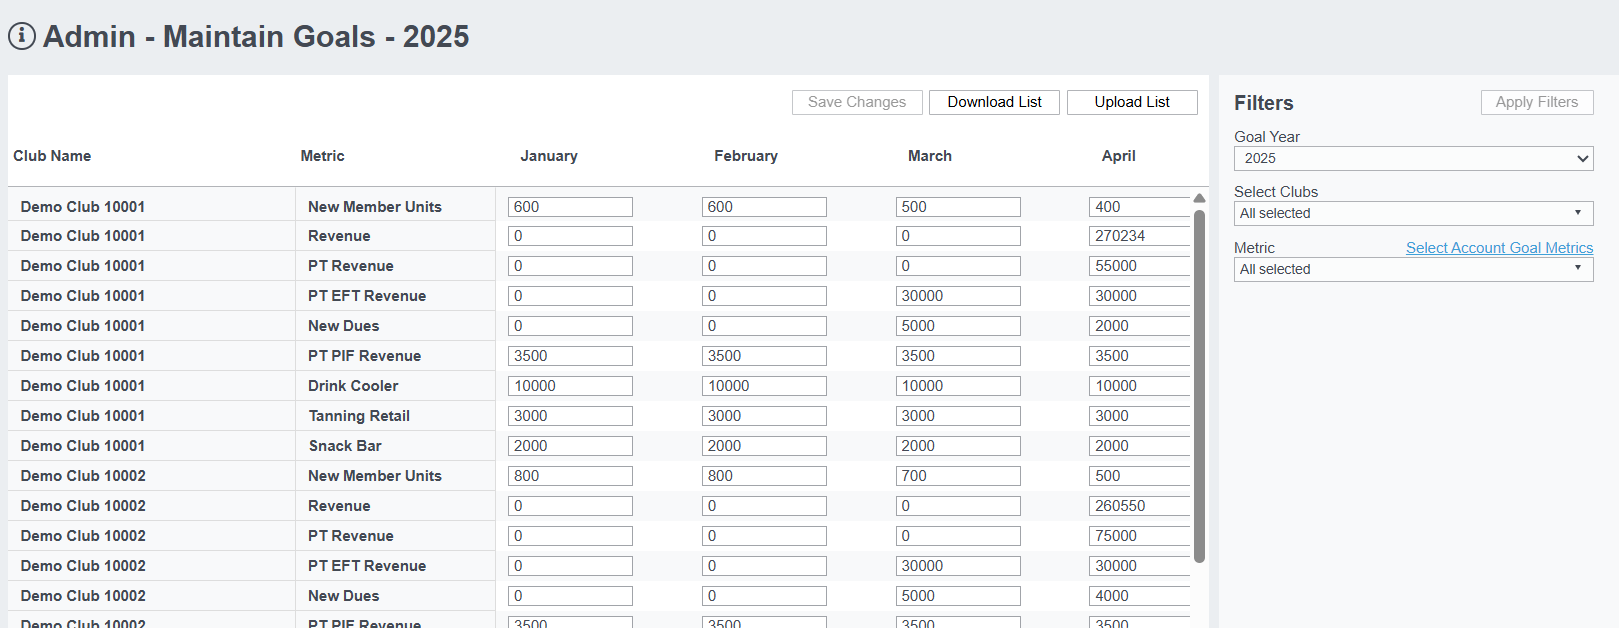
4.1 How to Enter Goals
-
Export the Goals template from the Goals Admin page.
-
Populate the spreadsheet with monthly goals for each club and each metric you want to track.
-
Upload the completed file back into Easalytics.
-
Goals update after the next nightly data refresh.
You can upload as many months or years as you’d like, and you can re-upload updates at any time.
Once you enter goals and the overnight process runs, you can see your goal performance in multiple dashboards, including: Goals, Goals Lite, Goals Period Compare, and many more. <link>
5. Leads Marketing Spend Data Entry
Optional -- for clients who purchase Easalytics' Leads product.
If your organization uses Leads and has an Engage Pro integration, you can upload your Marketing Spend to power cost metrics throughout the Leads dashboards.
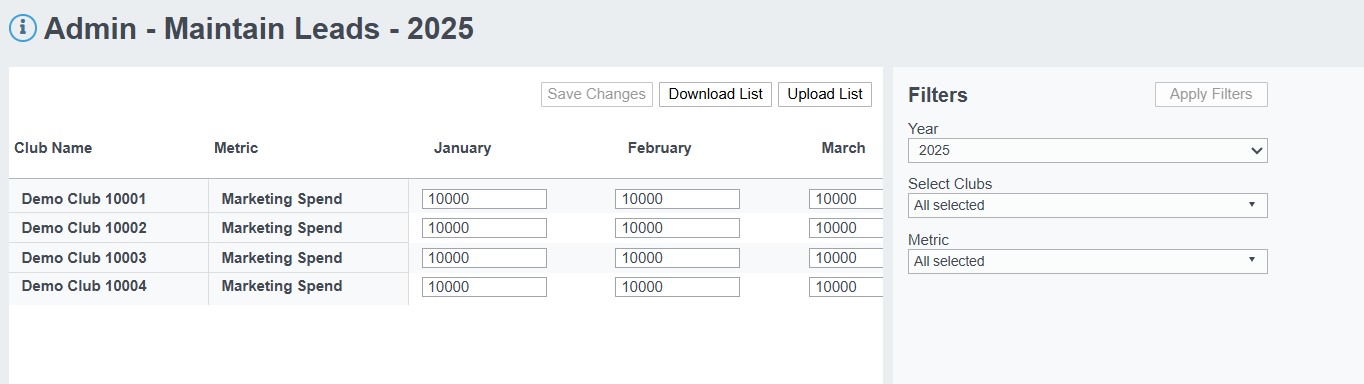
5.1 How to Enter Leads Marketing Spend Data
-
Export the Leads/Spend template from the Leads Admin page.
-
Fill in monthly spend values per club.
-
Upload the completed file back into Easalytics.
-
Updates apply after the nightly data refresh.
Marketing Spend values will populate in our Leads Conversion Dashboard, powering the Cost per Lead (CPL) and Cost per Acquisition (CPA) metrics.
6. Setting Up Your Topline Dashboards
Now that you're starting to feel comfortable with the data groupings and the data quality compared to your MMS, and you may have your Goals values entered, it's time to get the Easalytics system set up for you and your team's regular use.
Our homepage "Topline Dashboard" gives you and your team quick access to the key metrics you care about right when you log in. See key metrics for
- Revenue
- New Members & New Dues
- Check-ins and Class Usage
- PT Sales and Usage
- Performance vs Goal (for clients who have the Easalytics' Goals product)
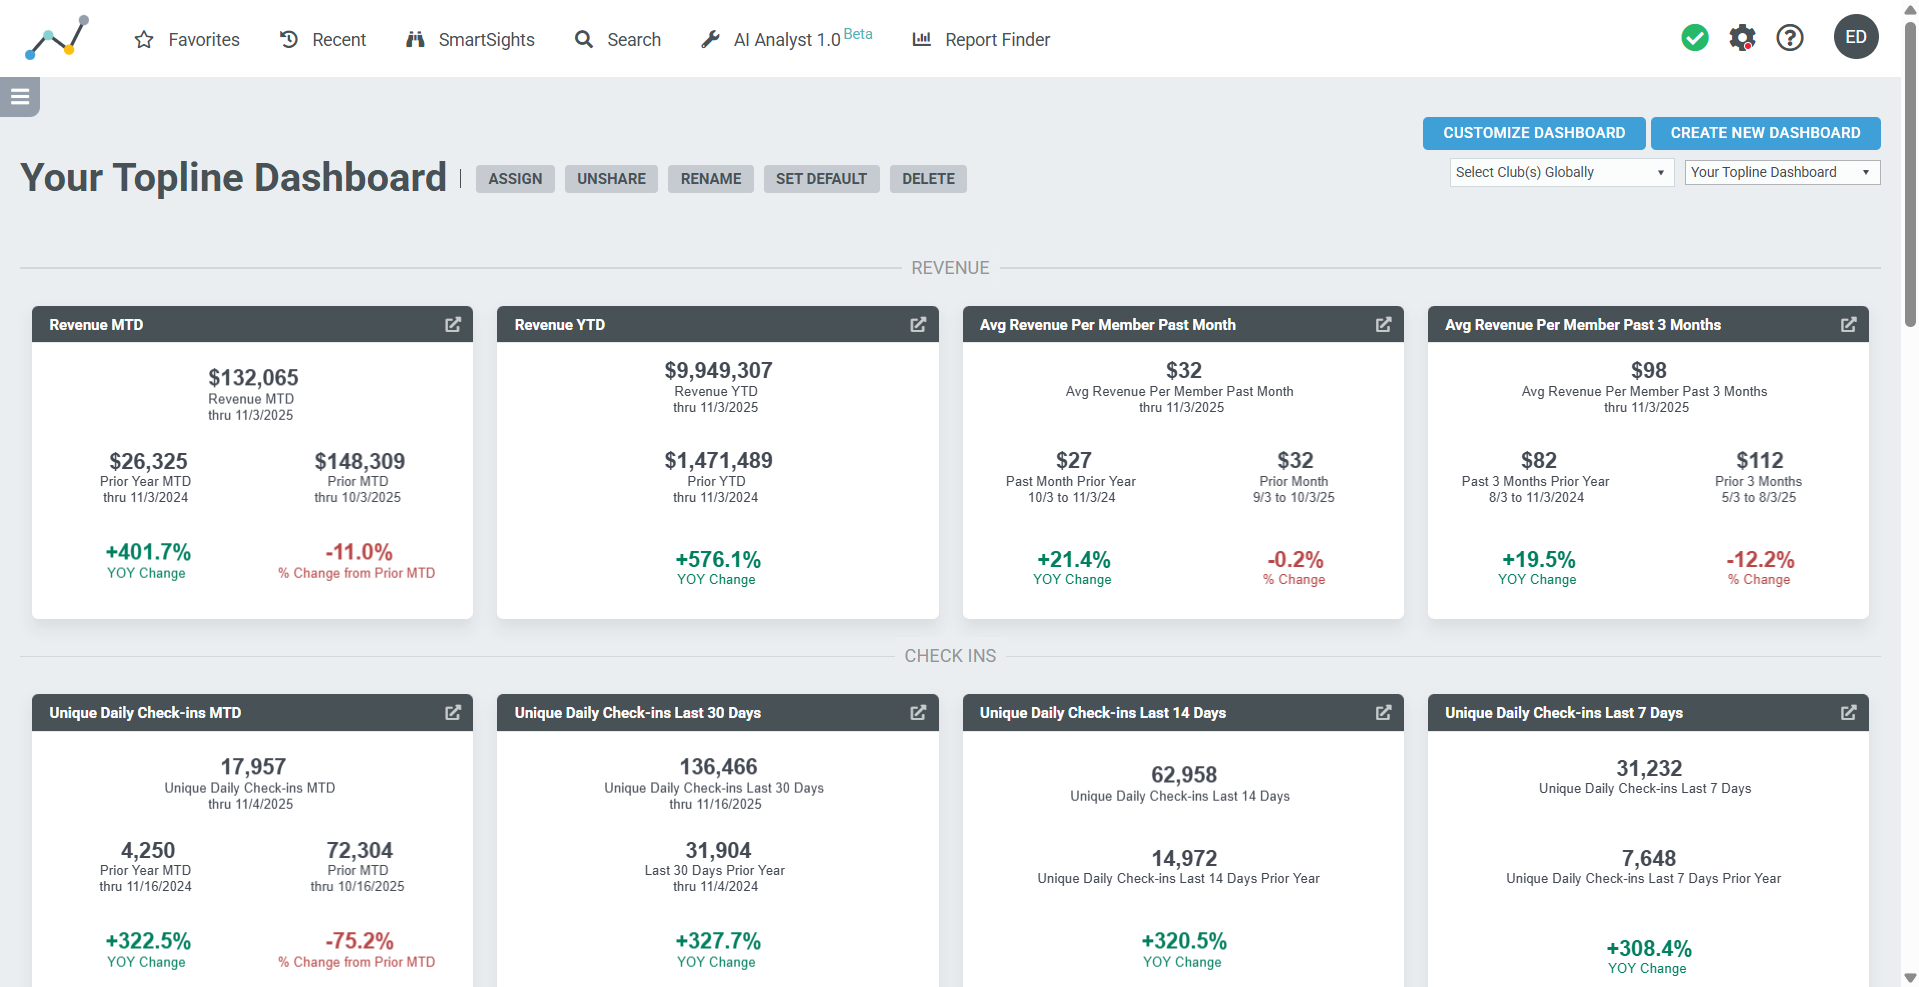
Each widget provides a snapshot of yesterday, month-to-date, or year-to-date comparisons, with the option to filter by club, club group, profit center group, membership type group, etc.
Users can click any widget title to open a full detailed dashboard with additional date ranges, deeper breakdowns, and supporting reports.
6.1 Creating & Customizing Dashboards
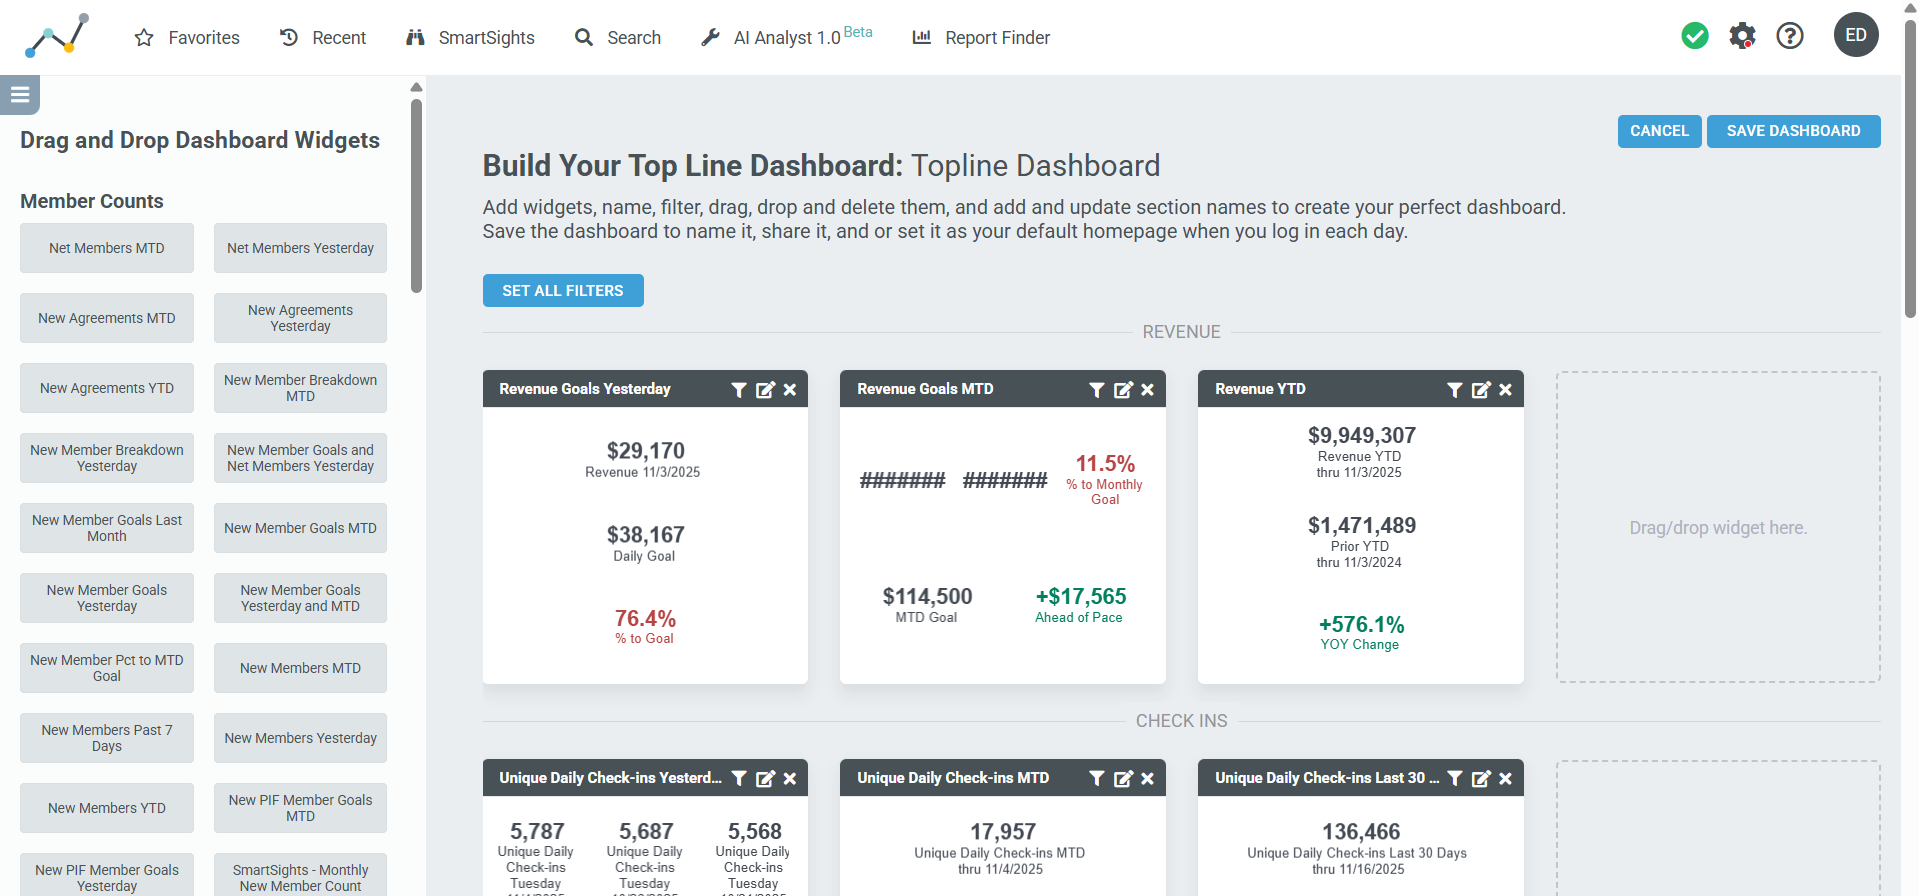
Admins and non-admins can create as many Topline dashboards as needed—for locations, regions, program directors, or corporate teams. Each dashboard can include any combination of widgets.
This feature lets you build role-specific dashboards that focus on the metrics each team uses most.
Widgets provide a high-level snapshot (e.g., yesterday, MTD, YOY) and can be filtered to show data for a specific Club or region, Profit center, Membership Type, etc. For deeper detail, users simply click the widget title to open the full drill-down dashboard.
6.2 Sharing & Assigning Dashboards
Admins have two ways to distribute dashboards to their users:
- Share (Read-Only)
- Sends an un-editable version of the dashboard to all users.
- Any future changes made by the admin will automatically update for all shared users.
- Shared dashboards appear in the user’s Shared Dashboards section.
- Use this when you want consistent reporting across teams.
- Assign (Editable Copy)
- Pushes a copy of the dashboard to selected users
- Assigned dashboards can be assigned as fully-editable or read-only depending on your preference
- Once assigned, the user’s copy becomes independent — changes to the admin’s original will not carry over.
- Users can customize or repurpose it as their own.
- Use this when giving users flexibility to build their own workflows.
6.3 Why Setup Topline Dashboards for your Team
- Keep your most Critical metrics front and center.
- Provide Consistency for your teams: When you identify best practice views (for a region, program, etc.), you can standardize how teammates access them.
- Get Faster Decision-Making: Less time spent configuring filters means more time acting on the data.
- Done correctly means your team logs in, sees their default dashboard, and immediately sees the metrics that matter — without extra clicks or setup each time.
7. Request Users to be set up
Now that you have Easalytics set up for your team, it's time to request your non-admin or general user logins to be set up. Send an email to support@easalytics.com with:
- User's First & Last Name
- User's Email for their username
- Preferred Default Password (if one)
Users will receive login credentials via email and can reset their password from there.
Please contact us if you're considering using a shared login (e.g. gm@club.com) and we can discuss the setup and expectations
8. Request Live Training for Your Team
With everything above in place, it's time to get your team involved! We offer live, usually via video conference, training for the Easalytics portal. Contact support@easalytics.com to setup some time and discuss a training plan.
SECTION 2: General User Guide
1. Easalytics Portal Navigation Options
As a user, you have three main ways to navigate around the Easalytics portal:
Side Navigation Menu
-
A categorized, expandable list of dashboards, and other important areas of the portal
-
Great when you know where you’re going (Revenue, Membership, PT, Classes, etc.)
Report Finder
-
A visual directory of dashboards
-
Helpful for new users still learning the layout
Search Bot
-
The fastest way to find any dashboard
-
Type keywords like “new members”, “check-ins”, or “PT usage”
-
Works even if you don’t know the exact dashboard name
-
Also suggests related dashboards based on your search
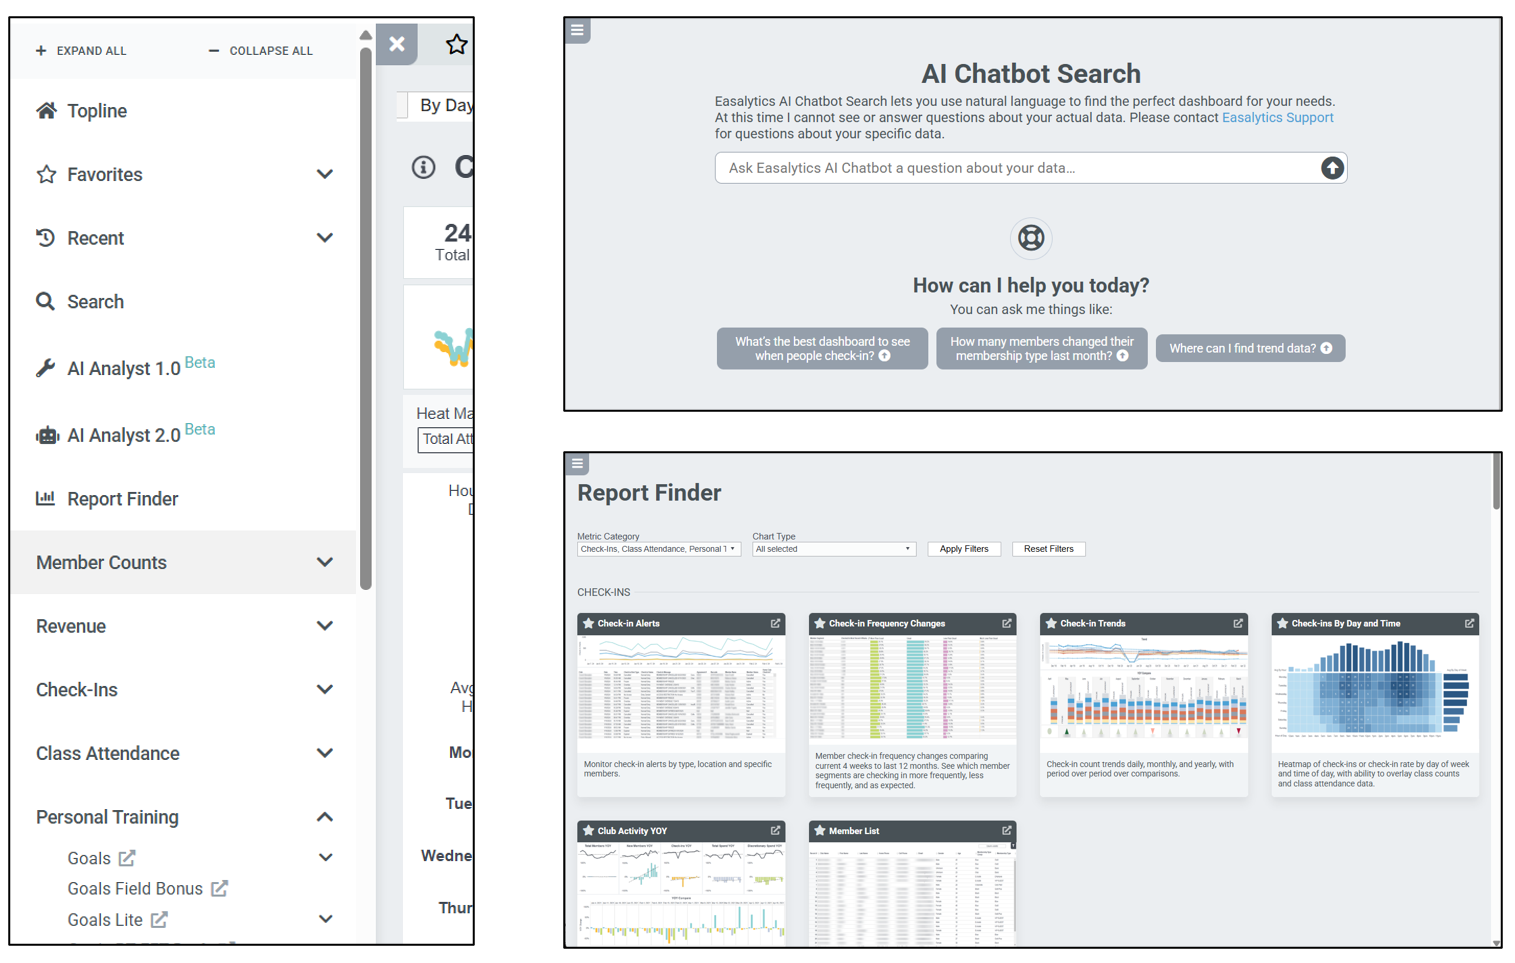
Video → Navigation Options: Report Finder, Search Bot, or Side Menu
2. Dashboard Filtering & Configurations
Every dashboard has its own filters and settings, allowing you to tailor results by:
-
Club / Club Group
-
Membership Type Group
-
Profit Center Group
-
Event / Class / PT Groupings
-
Date ranges
Filters update the dashboard instantly and you can combine multiple filters. Clearing filters or refreshing the webpage resets the dashboard to its default state.
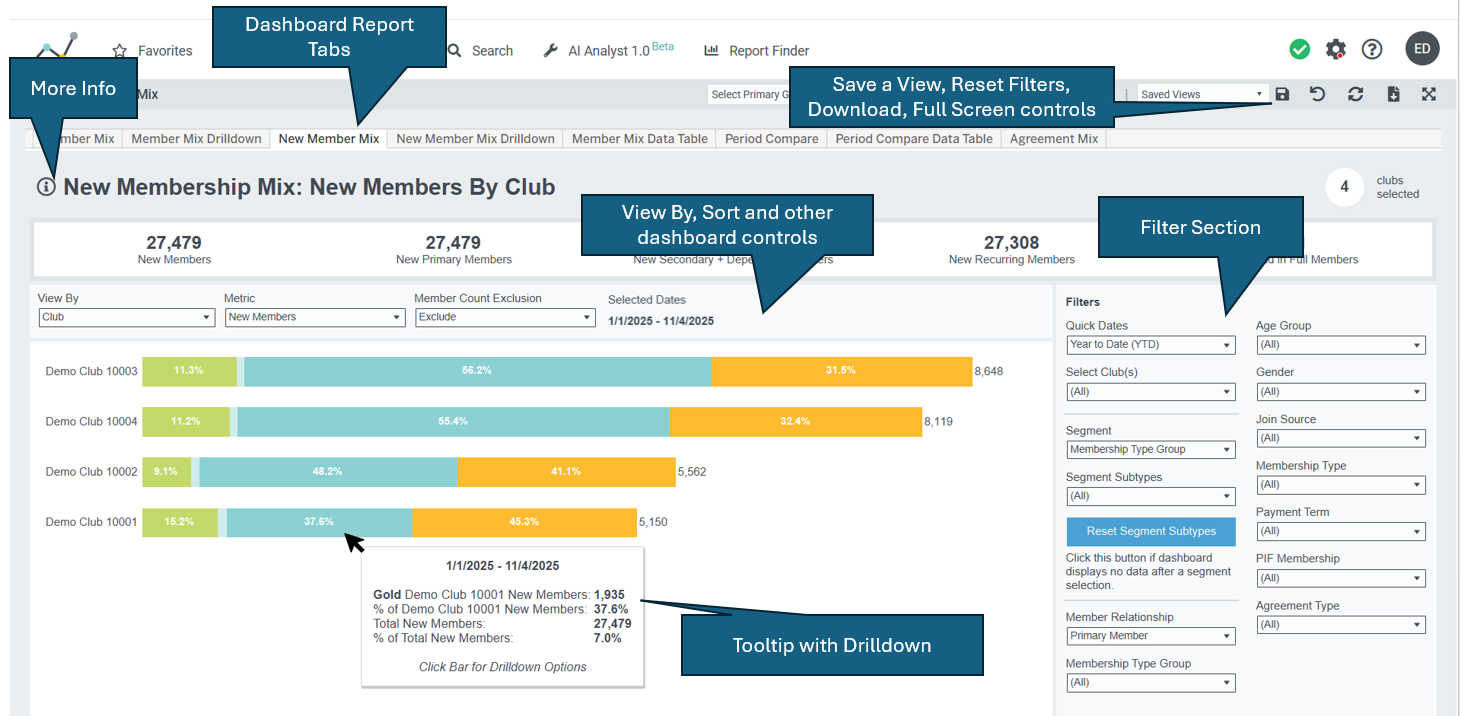
When you find a group of filters and settings you want to come back to, Save a View! See the saved view section below for more info on that.
Video → Filtering & Configuring Dashboards
3. Dashboard Tooltips & Drilldowns
Hovering over a metric reveals:
-
More details and breakdowns about the number and the row
-
Links to Member-level lists and member demographic breakdowns
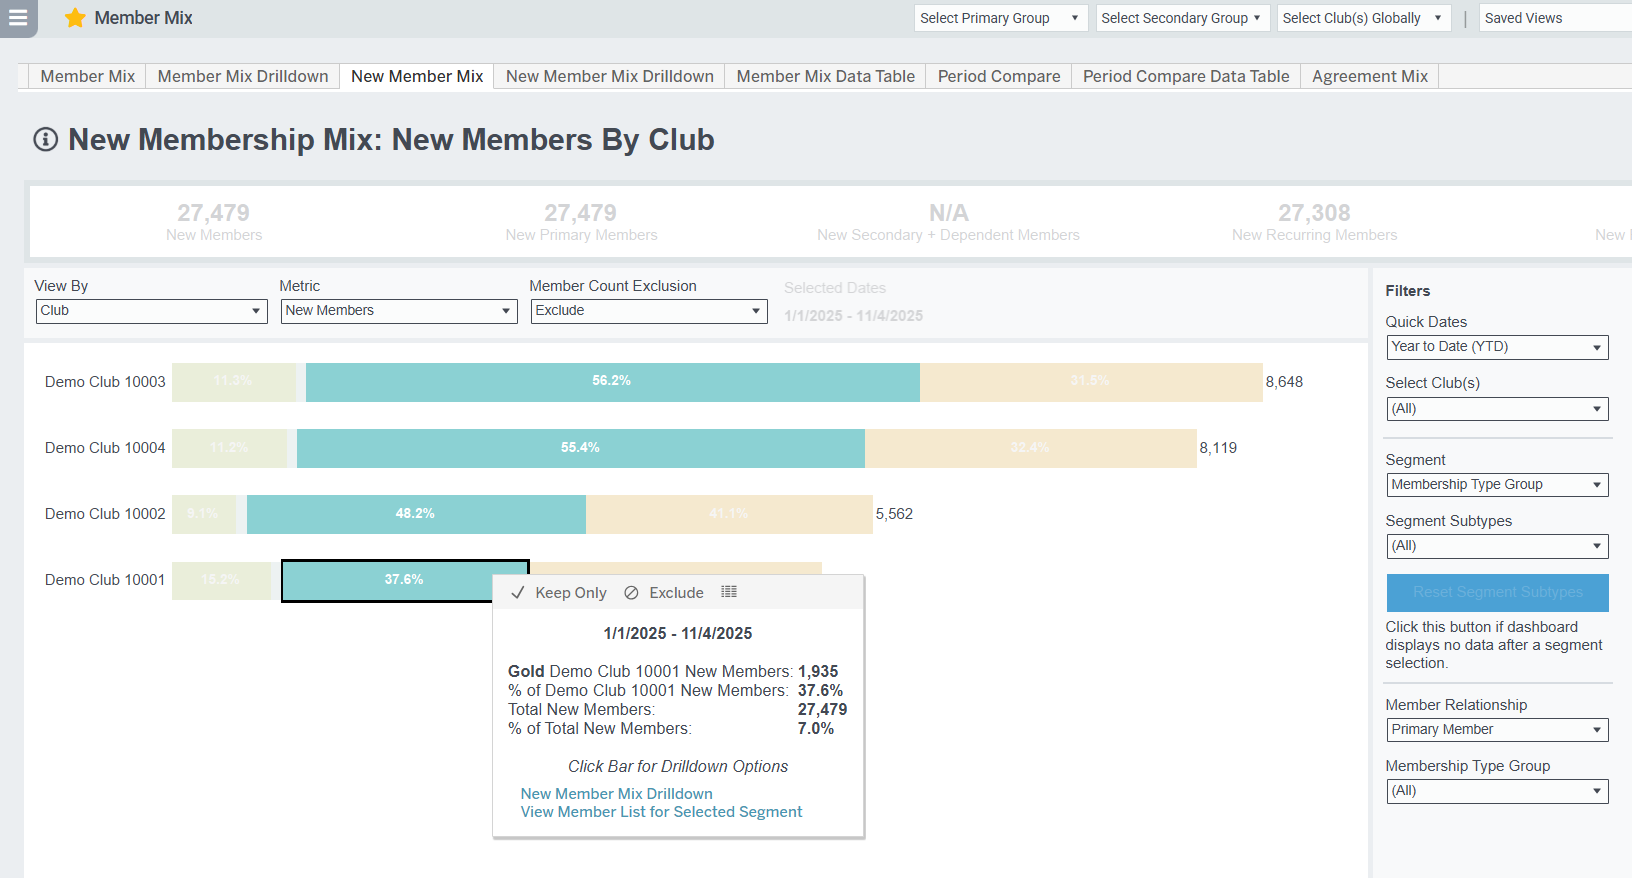
Video → Tooltips and Drilldowns
4. Global Club Filter & Club Groups
Tables can't be imported directly. Please insert an image of your table which can be found here.
The Global Club Filter lets you select a Club or Club Group once, and have it carry across most dashboards while navigating.
-
This is ideal for GMs or Regional Directors jumping between dashboards but want to look at only a subset of clubs
-
You can clear the Global Club Filter at any time to return to all-club views
-
The Global Club Filter works with Saved Views and Favorites as well
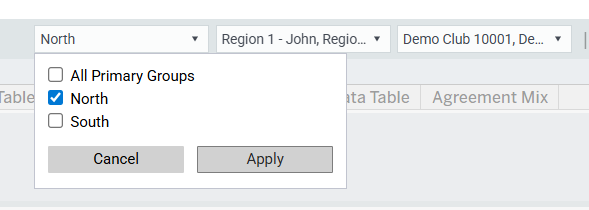
The options in the Primary Club Group and Secondary Club Group are derived from your Club Grouping exercise above. Primary and Secondary grouping can be maintained in the Easalytics Admin section.
Video → Global Club Filter
5. Exporting Dashboards
If you need to export a dashboard or data from Easalytics, you're in luck. Dashboards are exportable in 2 formats:
-
PNG image file -- for insertion to presentations or emails
-
Excel -- only available on "Data Table" tabs and allows for further analysis
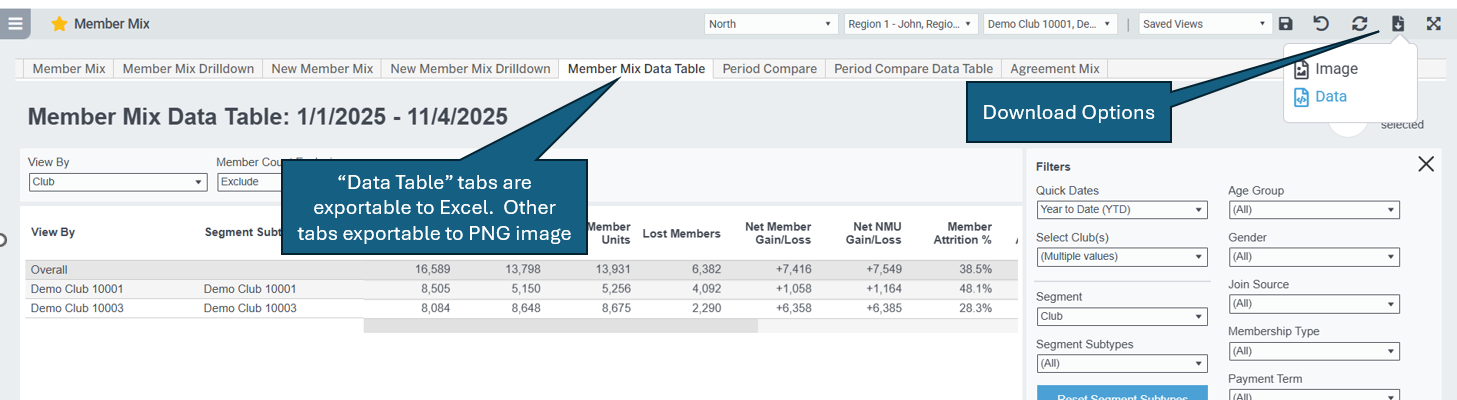
Video → Exporting Options
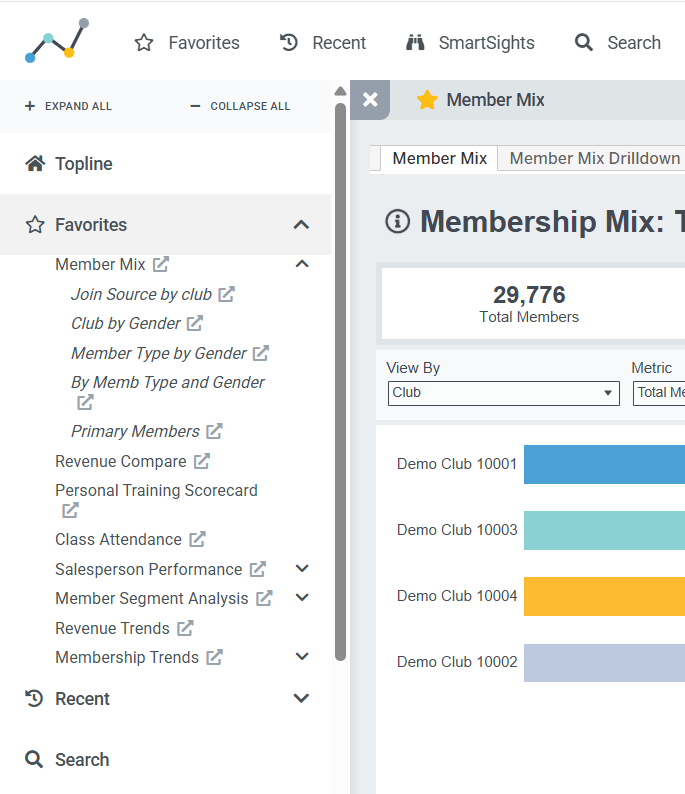
6. Favorites & Saved Views
6.1 Favoriting Dashboards
Tables can't be imported directly. Please insert an image of your table which can be found here.
As you dive into Easalytics, you’ll likely identify dashboards you use most frequently.
You can click the star icon on any dashboard to add it to your Favorites, which appear at the top of the side navigation.
Benefits include:
-
No digging through menus
-
Your most-used dashboards become one-click
-
Organizes your personal workflow
-
Work seamlessly with Saved Views on your favorite dashboards
And, the Recent menu automatically displays dashboards you’ve viewed most recently—helpful for fast back-and-forth analysis.
6.2 Saving Customized Views
If you use a recurring set of filters (e.g., Club A + PT Group + Last 30 Days) or have different filters settings you'd like to come back to, you can Save a View. In fact you can save multiple views of any of our standard dashboards.
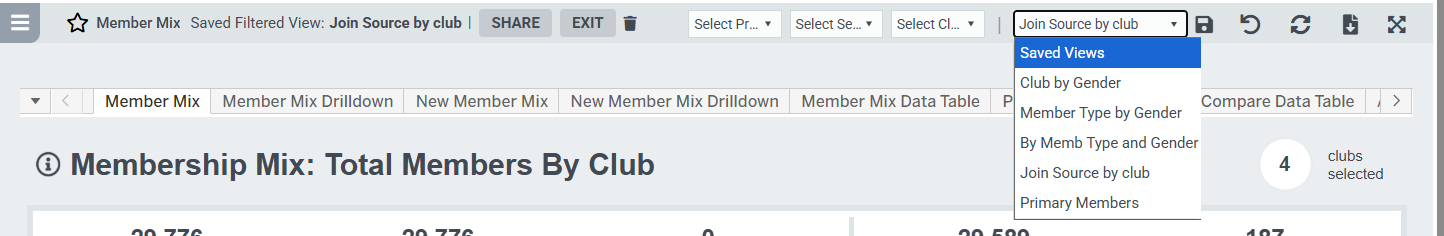
- Once a dashboard is open, apply filters or settings (for example: a specific club or profit-center, date range, segment).
- Then click the Save View Disc icon to store that exact combination of filters/settings with a name of your choosing.
- Your saved views will be available in the saved views dropdown of the dashboard AND in the left nav menu below the main dashboard link.
Video → Saving Customized Views
You're Ready to Go
That’s it! You’re now ready to begin using Easalytics with confidence—from setting up clean data foundations to navigating dashboards, creating custom views, and sharing insights with your team.
As you explore Easalytics, remember: You can’t break anything, and every dashboard is built to help you get answers faster.
If you ever get stuck, our help videos, Knowledge Guide articles are only a click away, and our support team, support@easalytics.com, is always here to help!
Welcome aboard—and enjoy your new data superpowers.
Related Articles