Release Notes July 10, 2025
In addition to performance improvements and bug fixes, the following visible updates were made:
Homepage Topline Widgets > Filter Previews and Open in New Tab
We've added two new features to the homepage Topline widgets to improve clarity and usability:
- Filter Preview: Widgets with filters applied now show a filter preview icon. Click to view a summary of selected filters, helping you understand the data context at a glance. If the widget is not filtered, you will not see the filter preview icon.
- Open in a New Tab: All Widgets link to full dashboards by clicking the title. Now each widget has an icon to "View full details in a new browser tab", making it easier to explore full reports and the topline dashboard concurrently.
To change widget filters or titles, account admins can click "Customize Dashboard" at the top of page and click the edit filter icon on the desired widget. If you don’t have access and want to make changes, contact your admin.
Enhanced Period Compare > Analyze Month-over-Month and Short-Term Trends
We've updated our Period Compare reports with more flexible "Quick Date" options for powerful short-term analysis. You can now go beyond standard year-over-year views and compare a period (like 'Last Quarter') directly against the period immediately preceding it (like '2 Quarters Prior').
This enhancement allows you to easily track month-over-month trends, measure the immediate impact of a new marketing campaign or operational change, and make faster, more agile decisions based on your most current data.
This update is available in the 'Period Compare' tabs on these dashboards:
- Member Mix
- Check-ins By Day and Time
- Class Attendance Trends
- Revenue Compare
- PT Sales Revenue and Enrollment
- PT Usage
- Personal Training Scorecard
- Goals Period Compare
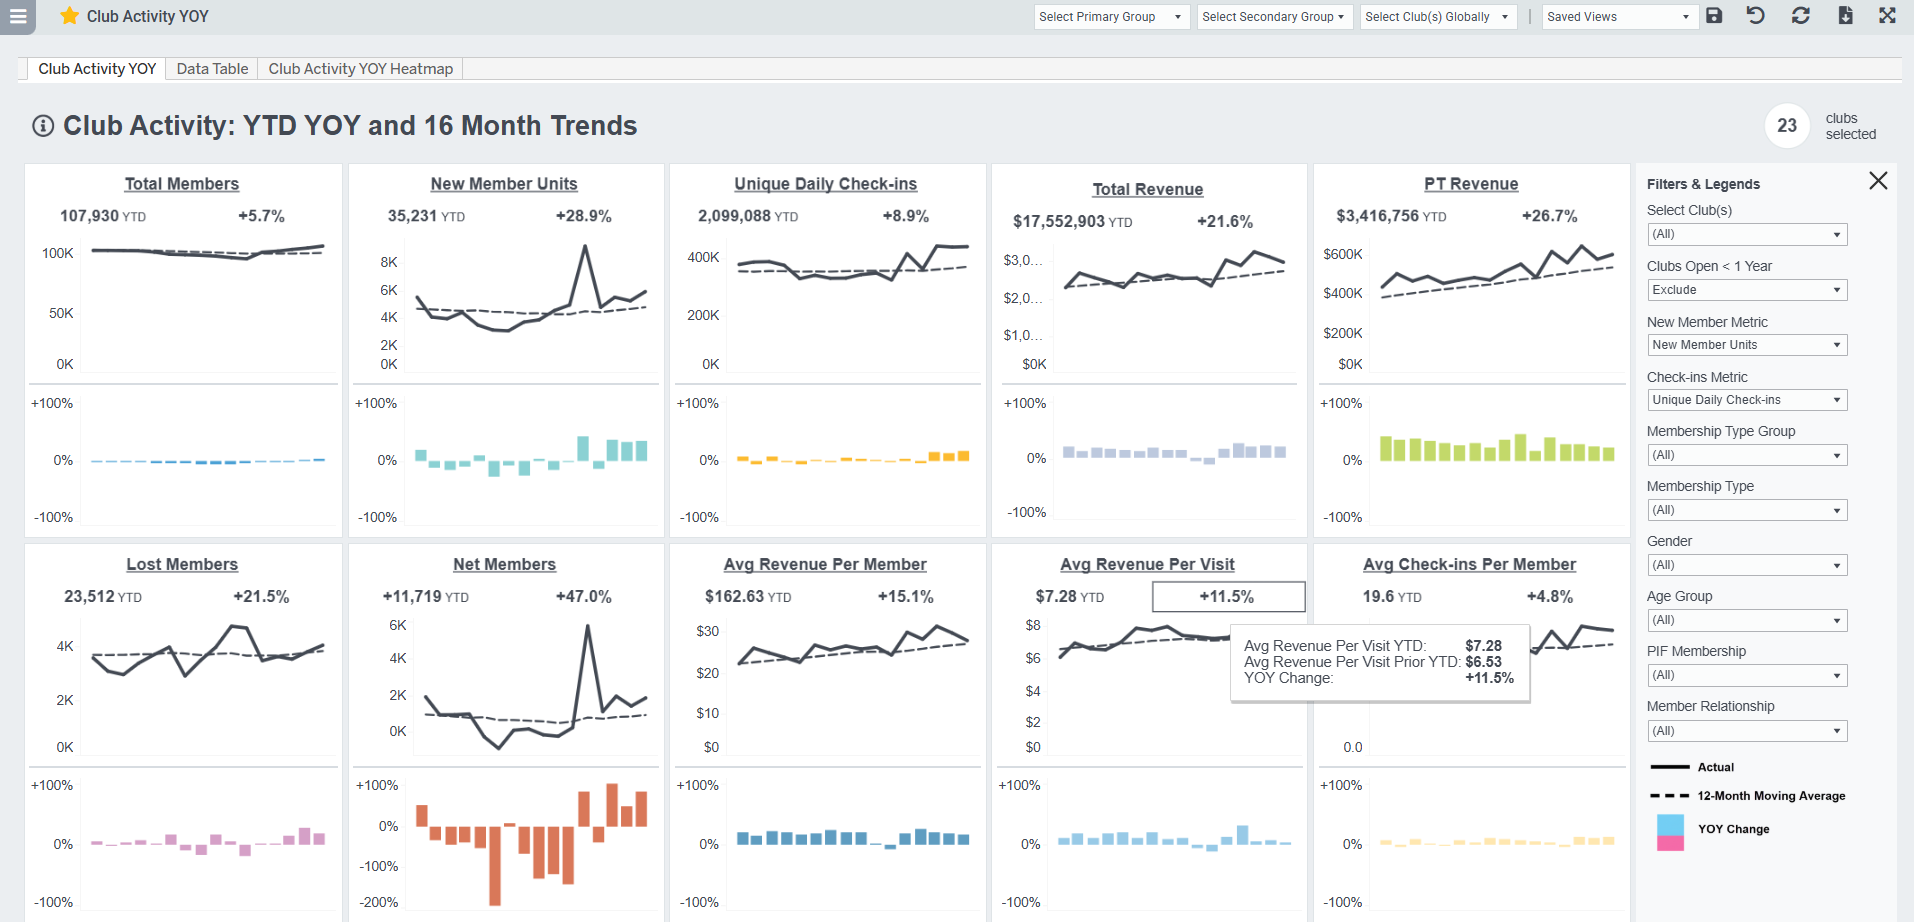
Club Activity YOY Dashboard Reimagined
We're excited to release a refresh to the Club Activity YOY Dashboard, designed to provide insights and a comprehensive view of your club's performance trends. This update addresses feedback on usability and introduces powerful features to help you quickly identify critical patterns.
The main dashboard tab has 10 Key Metric sections with YTD metrics, YOY % change, monthly trends, and a 12-month rolling average. You'll discover:
- An expanded set of metrics
- Linked section titles to the full trends dashboards
- Expanded data table with YTD actuals, prior year actuals, and % change for all key metrics
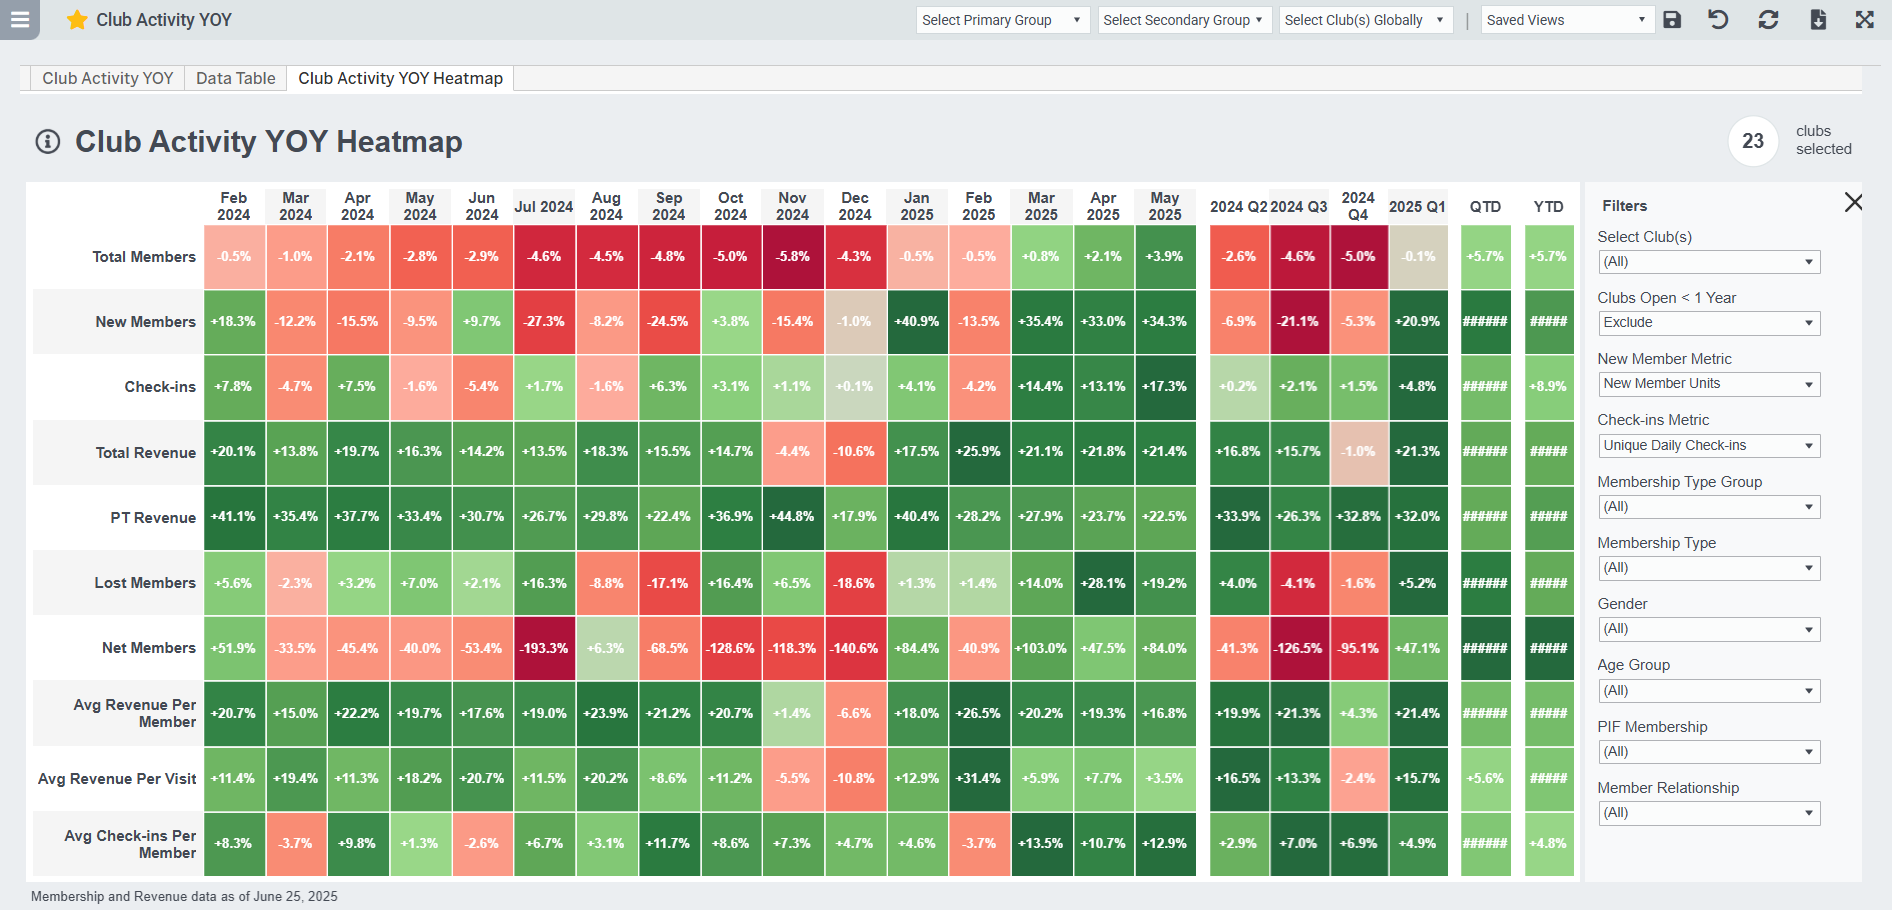
- And, check out the new 'Heatmap' tab, which provides a unique visual summary to quickly pinpoint monthly performance shifts.
Tables can't be imported directly. Please insert an image of your table which can be found here.

PT Performance Tracking Enhancements
We've made a number of targeted updates to improve accuracy, expand visibility, and surface more meaningful performance metrics.
- PT Close count logic update > we are now counting PT Closes related to a PT Intro Book & Show only if they happen within 30 days of the Show. Plus, we're now counting multiple PT Intro session Closes for an individual if they have taken multiple PT Intro sessions over time. These updated metrics now appear in PT Scorecard and the PT Sales Revenue Enrollment > PT Trainer tab.
- NEW! PT Book on Join Date > we have added new metrics to the PT Scorecard and Salesperson dashboards tracking the number of new members booking a Personal Training Intro / Kickoff session within 24 hours of their join date. We also added PT Book on Join Date % representing the % of New Member Units that booked a PT Intro on their first day.
- PT Freeze as of any date> Based on client requests, we updated the PT Sales Revenue Enrollment dashboard Freeze PT tab to allow you to see member counts and recurring PT draft on freeze as of any given date.
- PT Sales now include negative transactions > based on client feedback, we're including negative transactions in our PT Sales Revenue Enrollment and PT Sales Trends dashboards to show reversals and refunds. You can see these transactions in the PT Transactions tab, and reflected in the summary on the main dashboard tab.
- PT Future Events now up to 45 days out > for clients using ABC member management system, we've made an enhancement to capture PT events scheduled up to 45 days in the future. This change will primarily affect future PT events in Member List and PT Book count metrics in the PT Scorecard and Salesperson Performance dashboards.
NEW! Class Calendar View
We’re excited to introduce a new “Calendar View” tab to the Class Attendance dashboard! This tab displays the class schedule in a clean, calendar-style layout, allowing you to quickly scan what's happening across clubs by day and time.
The view includes interactive hover tooltips showing key metrics, and several filters, making it easy to assess performance at a glance. Classes are color-coded by Class Group, and each class includes a drilldown to more details about the scheduled class. This view is ideal for spotting scheduling gaps, tracking new class adoption, and managing class mix across locations.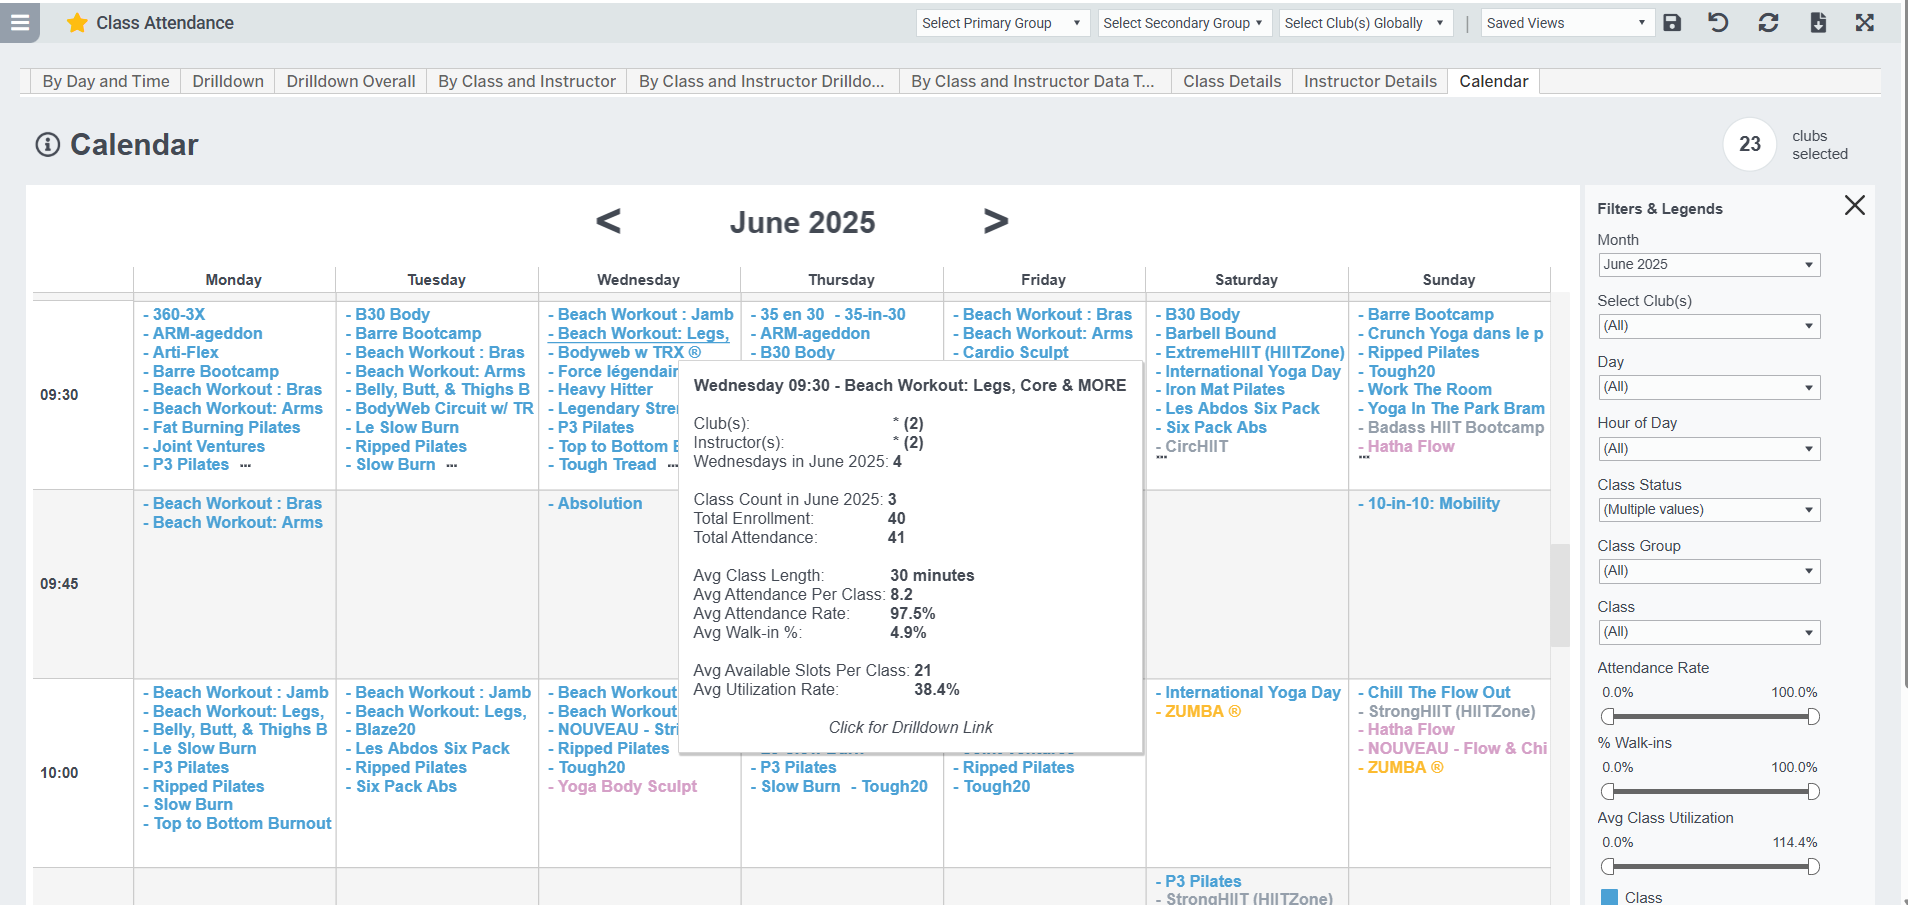
Total Attendance and Walk-Ins Metrics Updates
For applicable class management systems, Class Attendance and Class Attendance Trends dashboards now include Walk-In Counts and Instructor Count. Total Attendance will include Registered Attendance + Walk-Ins. It will NOT include registrants who un-enrolled / were deleted from the class. Clients using Instructor Count will now see that broken out into Walk-Ins and Registered attendees based on the Walk-Ins count field. These are the slightly modified metrics:
- Total Attendance = [Registered & Attended] + [Walk-in Count]
- Registered & Attended =
For GroupX Instructor Count clients: [Instructor Count] - [Walk-In Count]
For GroupX Taking Attendance clients, and all other clients: [count of unique enrolled members marked as attended] - Instructor Count = number entered by instructor as total attendance
- Walk-In Count = number entered by instructor
- Attendance Rate = [Registered & Attended] / [Enrolled Members]
- Utilization Rate = [Total Attendance] / [Total Slots Available]
Member List Updates
- Updated the Agreement Type filter to include all value options we see in your member management system, not a default list
- Added an overall Active Member filter. Easalytics considers a member active if: for ABC Fitness, that flag is set in the member management system; for Club Automation, if a member has an active agreement; and for Jonas Fitness, if a member has an active agreement and member status is not Terminate.
- Added First PT Intro Book Date, Last PT Intro Book, Set, Show, and Close date fields. Note the logic updates above.
- Added a filter for Age Generation
- Updated the ABC member Agreement Number to now include the club number prefix to match to other ABC reports
- Updated the exported file name for Member List and Saved Cohorts so it's easier to identify the downloaded file when you have multiple downloaded.
NEW! Agreement Mix View
We've added a new tab to the Member Mix dashboard focused on Member Agreements. This tab is built directly on the Easalytics Member List and offers a highly configurable look at your current agreement and member distribution. Key segments and filters include: Agreement Status, Agreement Type, member since date, and agreement sale date. This will be a great tool for anyone trying to find their current active agreement base.
Lost (Terminated) Member Metric Update
For clients using our Jonas Fitness member management integration, this release we are updating our Lost Member and overall Active Member flag based on handling members being removed (deleted) from an agreement that continues to be active. This was inflating our total member count and deflating our lost member count metrics. You'll see this updated in all our membership dashboards (e.g. Member Mix, Membership Trends, etc.) and in Member List.
Other Noteworthy Enhancements
- Check-In Trends & Class Attendance Trends > added a Daily Trends tab, defaulted the dashboard to show clubs open < 1 year, added an option to show/hide the trend lines in the graph.
- Attrition Trends > added Total Members BOM (beginning of month) to help visually explain the lost member Attrition Rate calculation.
- Member Average Revenue > added the quick dates date picker feature, updated & improved the dashboard styling
- Quick Dates > spelled out selected date ranges in any dashboard with the quick dates selector for ultimate clarity
- Goals New Members > added Avg Dues to the Data Table
- Goals & Goals Lite > when you click a top link to navigate to another goals dashboard, now the quick date selections follow you to the new dashboard
As always, please share any suggestions for enhancements, new reporting, and new ideas to support@easalytics.com.