We are excited to introduce Easalytics' Leads Conversion analysis dashboard, and our integration with Engage Pro (formerly VFP) by Daxko.
The new dashboard and integration will provide the ability to report on and analyze leads metrics such as lead conversion percentage by various dimensions, cost per lead, cost per acquisition, and average dues. Cost metrics are based on monthly marketing spend your Admin can enter/upload into a new Leads Admin section.
If you are using Engage Pro (VFP) for your CRM and marketing leads tracking, contact sales@easalytics.com to inquire about adding this new Easalytics product
Leads Analysis
- Understand your lead acquisition by club, Salesperson, lead demographics, Lead Type and Lead Source.
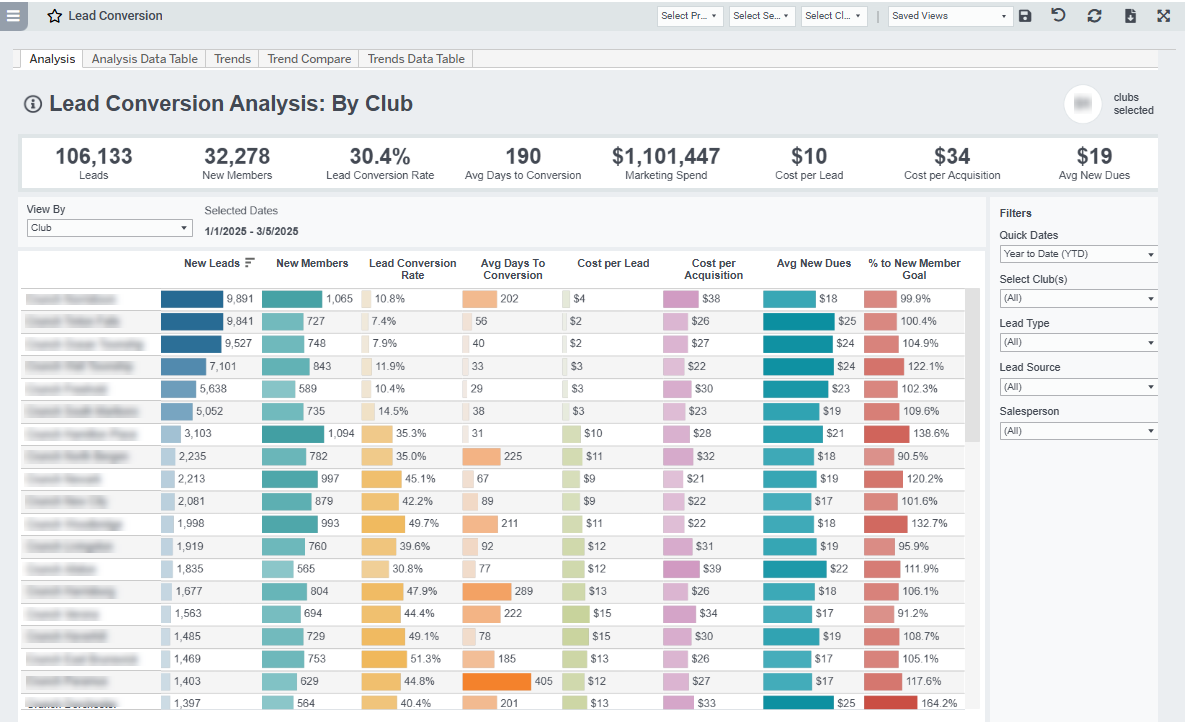
- Analyze the Lead Conversion Rate to see which clubs or salespeople are being most or least efficient in converting leads to members.
- See below for Lead Metric Definitions
Tours
- Understand your Tour performance by club, salesperson, lead demographics, Lead Type and Lead Source. Analyze the Tour Conversion Rate to see which clubs or salespeople are being most or least efficient in converting leads to members.
- Target Days to Conversion -- this concept allows you to set how quickly you expect a Tour to convert to a member to 'count'.
CAUTION: This analysis window for conversion could make the report show new members coming from tours larger than new members in the time period (e.g. 200% of New Members from Tours). - See below for Tour Metric Definitions
Trends and Trend Compare
Trends and Trend Compare-
Analyze trends of New Leads, Tours Given, Lead Conversion, Tour Conversion, Days to Conversion from Lead to Member or Tour to Member, Cost per Lead, Cost per Acquisition\
-
View by by club, lead origin, and more over time.
-
And with the Trend Compare tab you can compare two metrics on the same graph
Goals
- Visually track progress in the familiar style used in our Goals dashboards.
- You can set your Lead Goal as a percent of your New Member goal in the dashboard, and quickly see which clubs are over- or under-performing month-to-date or across any time.
Possible Uses
- Understand your lead acquisition by club, salesperson, lead demographics, Lead Type and Lead Source.
- Analyze the Lead Conversion Rate to see which clubs or salespeople are being most or least efficient in converting leads to members.
Leads Metric Definitions
- New Lead: newly created leads in Engage Pro / VFP based on the date the lead was created.
- New Members: new first time members based on the date they became a member.
- Lead Conversion Rate: in the report date range, # of New Members divided by # of New Leads.
- Avg Days to Conversion: difference in days between when the person originally became a lead to when they first became a member.
- Marketing Spend: your Admin can enter/upload monthly marketing spend values into the Leads Marketing Spend Admin section.
-
-
- Note: we break the monthly value into a daily value based on the # of days in a month
-
-
- Cost Per Lead: The Marketing Spend for the time period divided by the number of New Leads in the time period
- Cost Per Acquisition: The Marketing Spend for the time period divided by the number of New Members acquired in the time period
- Avg New Dues: For the new members on recurring billing, what is their average monthly dues amount
- New Member Goal: your Admin can enter/upload monthly New Member goal values into the Goals Admin section.
- % to New Member Goal: New Members for the time period divided by the New Member Goal value in the time period.
-
-
- Note: we break the monthly goal into a daily goal based on the # of days in a month
-
-
Tours Metric Definitions
- Tours Given: The count of tours given, not affected by the target days to convert
- Tour Target Days to Conversion: a setting in the Tours dashboard for the window where you want to say the Tour gets credit for the person becoming a member. This is defaulted to 30 days in our dashboard, meaning that we're giving credit to a tour for converting the person to a member up to 30 days after the tour happened. CAUTION: This analysis window for conversion could make the report show new members coming from tours larger than new members in the time period (e.g. 200% of New Members from Tours). This is because the default 30-day window could span into the next reporting period.
- New Members from Tours w/in Target Days: count of new members who were given a tour in the time period that became new members within the Target Days to Convert, which could be outside the time period.
- Tour Conversion Rate: [New Members from Tours given in the time period that converted w/in Target Days] divided by the total [Tours Given] in the time period.
- % of New Members from Tours: [New Members from Tours given in the time period that converted w/in Target Days] divided by the total [New Members] in the time period.
- Avg Days from Tour to Conversion: the average days it took between having a tour and becoming a member, for tours given in the time period that lead to memberships.
Related Dashboards
- Lead Conversion Trends & Trend Comparison
- Leads Marketing Spend Admin
- New Membership Mix
- Membership Trends